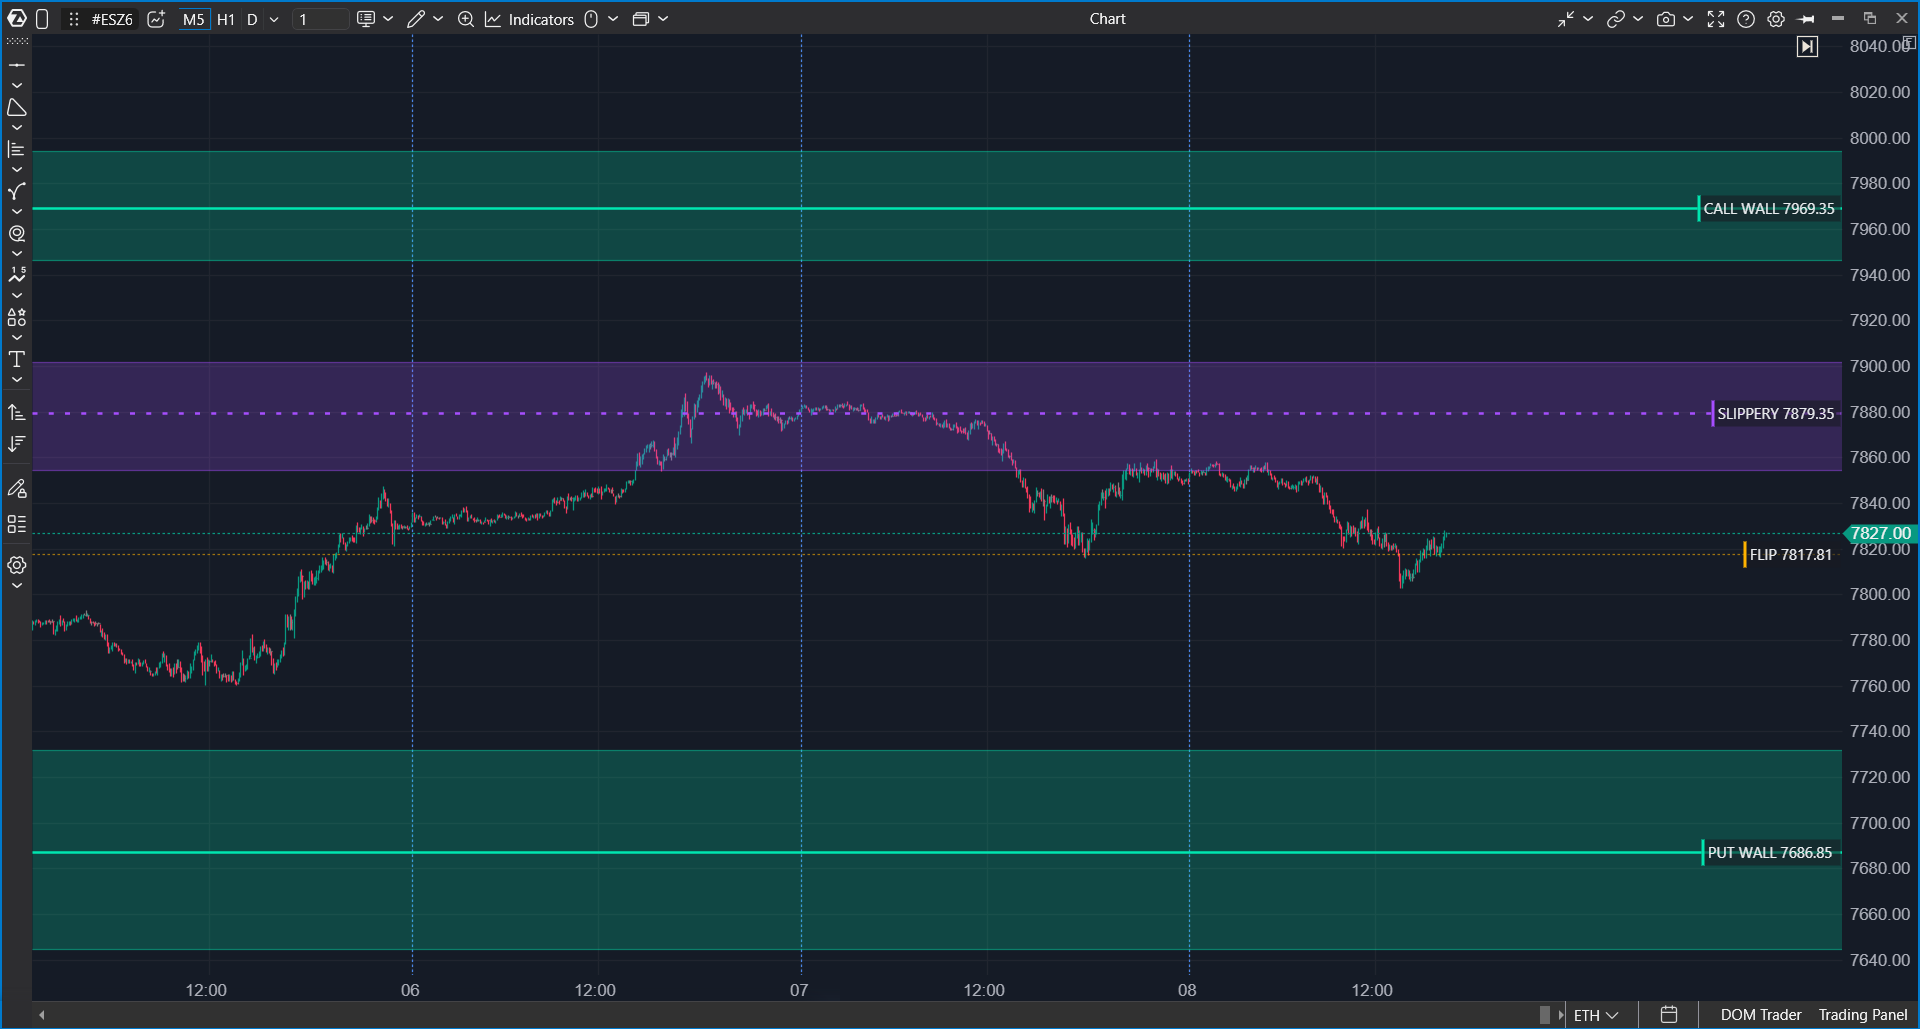
Options X-Ray: Key Levels draws the most important option levels of the current moment on an ES, MES, SPY, or US 500 chart as labeled lines: the call wall, the put wall, the slippery zone, the regime boundary, and, if you enable it, the pin. You turn it on and read the levels right away: no profiles, heatmaps, or metric settings.
It looks like Options Chain: Key Levels, but the levels are calculated differently. Options Chain: Key Levels uses open interest, which updates once per day. Options X-Ray: Key Levels uses market-maker positioning that is recalculated every minute, so a level that appears during the session shows up on the chart the same minute.
Why Use It
Market makers trade options with other participants and then balance their risk with ES futures. At some price levels this forces them to trade against the move: they sell into rallies and buy into drops, and price tends to slow down. At other levels they have to trade with the move, and price passes faster. Key Levels shows where these levels are right now.
The other Options X-Ray indicators show the same forces in more detail: GEX Heatmap shows the whole picture across price and time, and Surface Profile shows it as a histogram. Key Levels takes only the result: a few labeled lines on a clean chart. It is the shortest way into the Options X-Ray package.
The indicator helps answer questions such as:
- Where is the nearest level above and below price where movement is likely to slow down?
- Is there a zone nearby where price may move faster than usual?
- Is price above or below the regime boundary, and has the character of the day changed?
- On an expiration day, which strike may pull price toward it?
Key Levels is not a trading signal. It shows where market-maker hedging is strong. Confirm entries with tape, clusters, and delta.
What You Should Know Before You Start
| Chart | Use an ES, MES, SPY, or US 500 chart. ES and MES work with any specific contract, for example ESZ5. The data is OptionsDepth analytics derived from CBOE market data for S&P 500 index (SPX) options, and it is mapped to the chart automatically. |
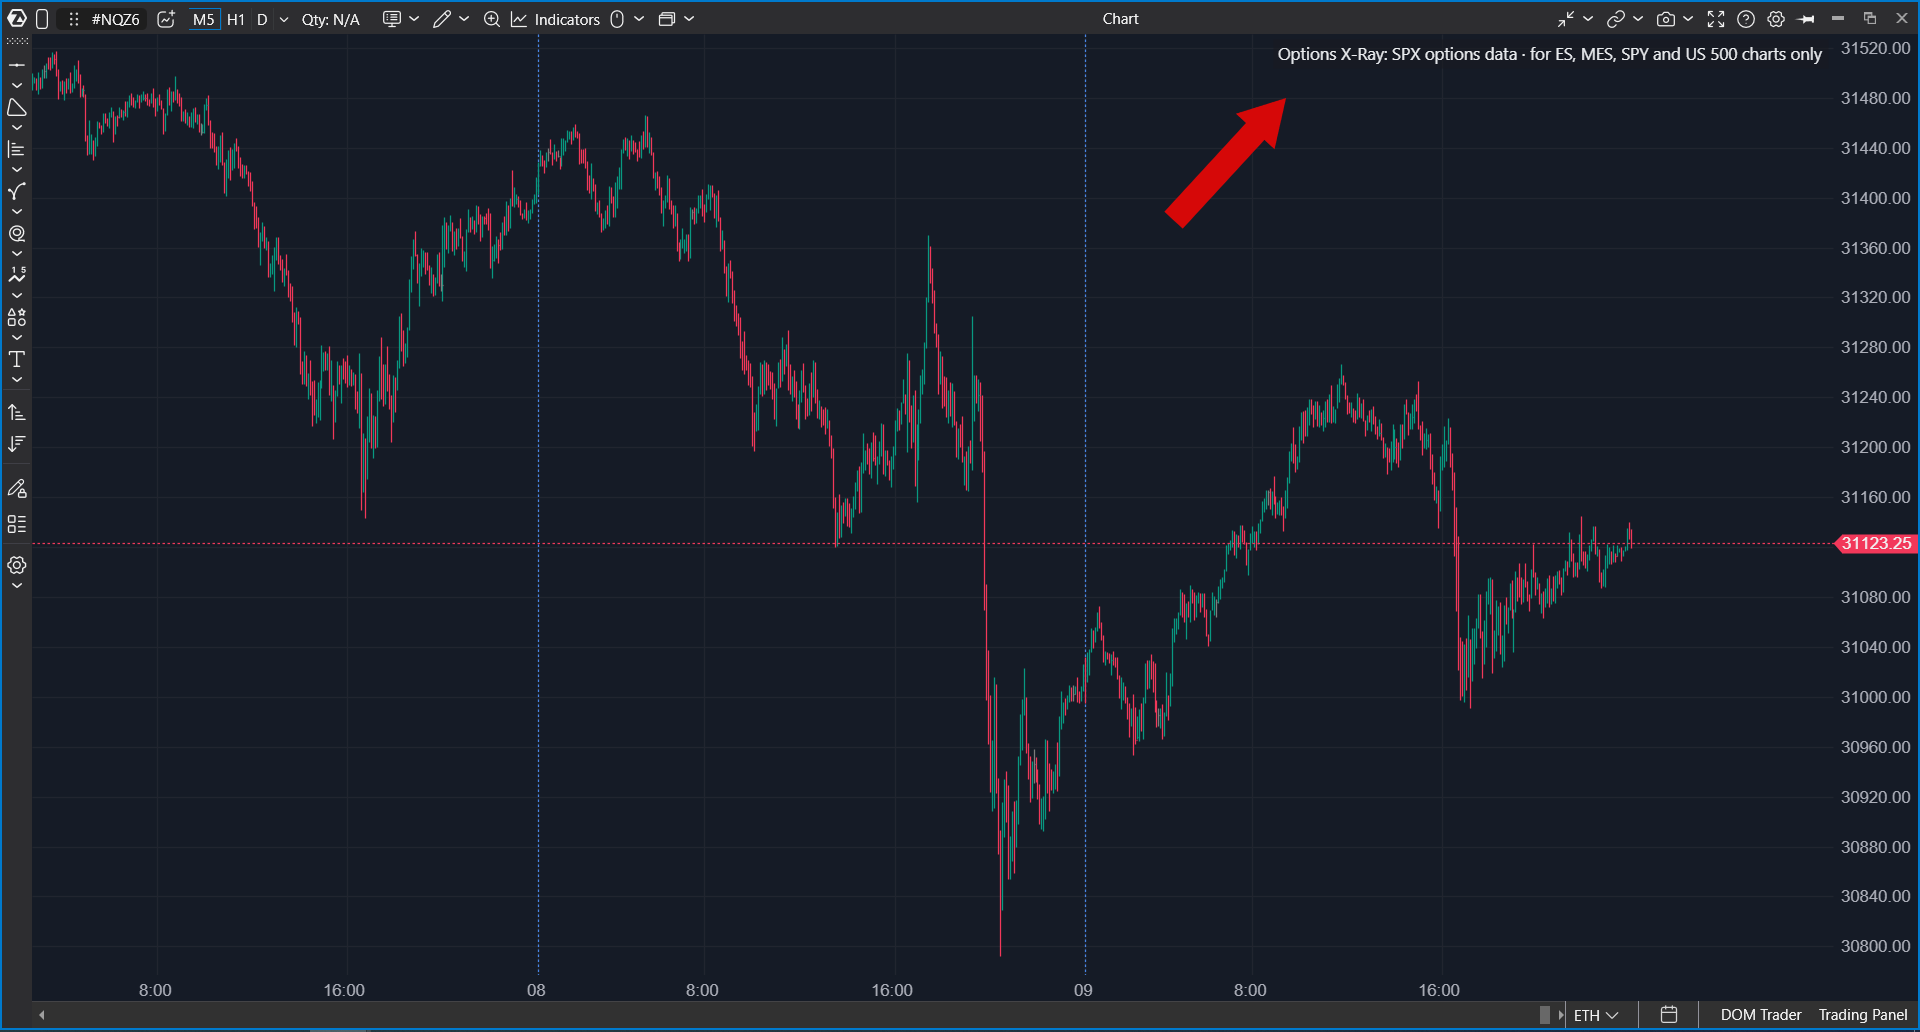
| Other markets | On any other instrument (NQ, oil, gold, individual stocks, crypto) the indicator draws nothing and shows an explanatory chip instead: Options X-Ray: SPX options data · for ES, MES, SPY and US 500 charts only. For other CME futures, use Options Chain: Key Levels. |
| Update frequency | The levels are recalculated once per minute. |
| Units | Level strength is shown in ES contracts: how many ES contracts market makers may need to buy or sell for each point of price movement at this level. |
| Access | Options X-Ray indicators are part of a separate package. If the indicator is not in the list, check whether the package is enabled in your account. |
| Data | Built on minute-level SPX options positioning analytics derived from CBOE market data. Data & analytics by OptionsDepth. |
What the Levels Mean
Each level has a label at the right edge of the chart with its name and price.
| Level | What it means | What to expect |
| CALL WALL | The strongest zone above price where market-maker hedging works against the move. | Price tends to slow down, stall, or pull back. It is drawn as a zone with a line at the strongest point. |
| PUT WALL | The same type of zone below price. | Price tends to slow down and find support. It is drawn as a zone with a line at the strongest point. |
| SLIPPERY | A nearby zone where market-maker hedging works with the move. | Price can pass through this area faster than usual. It is drawn as a dashed line with a zone around it. |
| FLIP | The regime boundary. Above it, hedging tends to damp movement. Below it, hedging tends to amplify movement. | When price crosses the boundary, the character of the day can change: from a calm range to sharp moves, or back. |
| PIN (0DTE) | The strongest strike near price where options expiring today hold price in place. | On expiration days, price may be pulled toward this strike. Disabled by default. |
The zone around a wall is not decoration. Its width shows how wide the slowdown area really is. A wall is not a single price where price must turn.
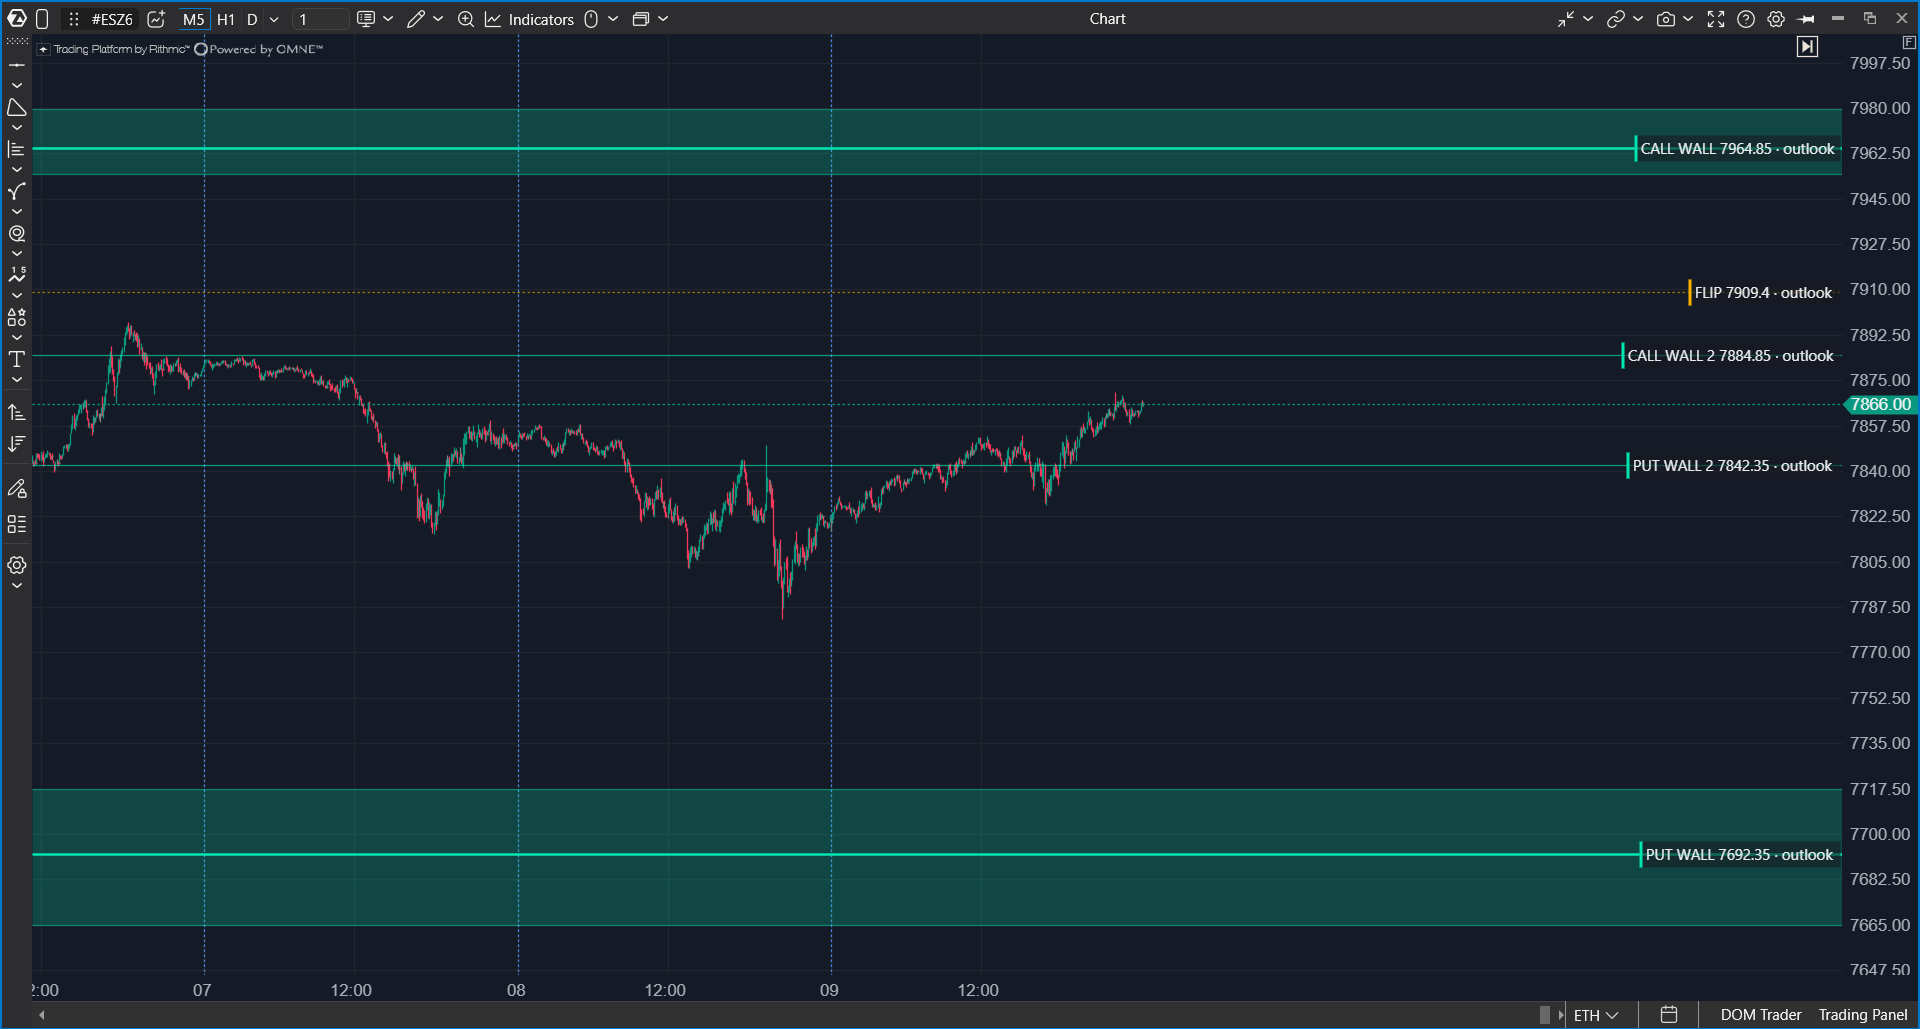
You can show up to three walls on each side. The main wall has a zone and a bold line. Additional walls are thinner and numbered, for example CALL WALL 2. They show where the next slowdown zone is if the main wall breaks.
Pin and Max Pain
Pin answers the same question as Max Pain: where price may be pulled toward expiration. Max Pain counts contracts and finds the strike where option buyers would lose the most. The count itself does not move price. What moves price is market-maker hedging around a strong strike, and this is exactly what Pin shows. For this reason, Pin does not have to match Max Pain on public websites.
Levels During and Outside the Session
The levels are recalculated every minute. A wall that did not exist in the morning can become the main level of the day by noon, and the indicator shows this right away.
Outside trading hours, the indicator shows a projection for the next session open based on the latest positions. The label and the card show outlook, so a projection is never presented as observed data.
Tooltip Card
Hover over a label or a line to open a level card.
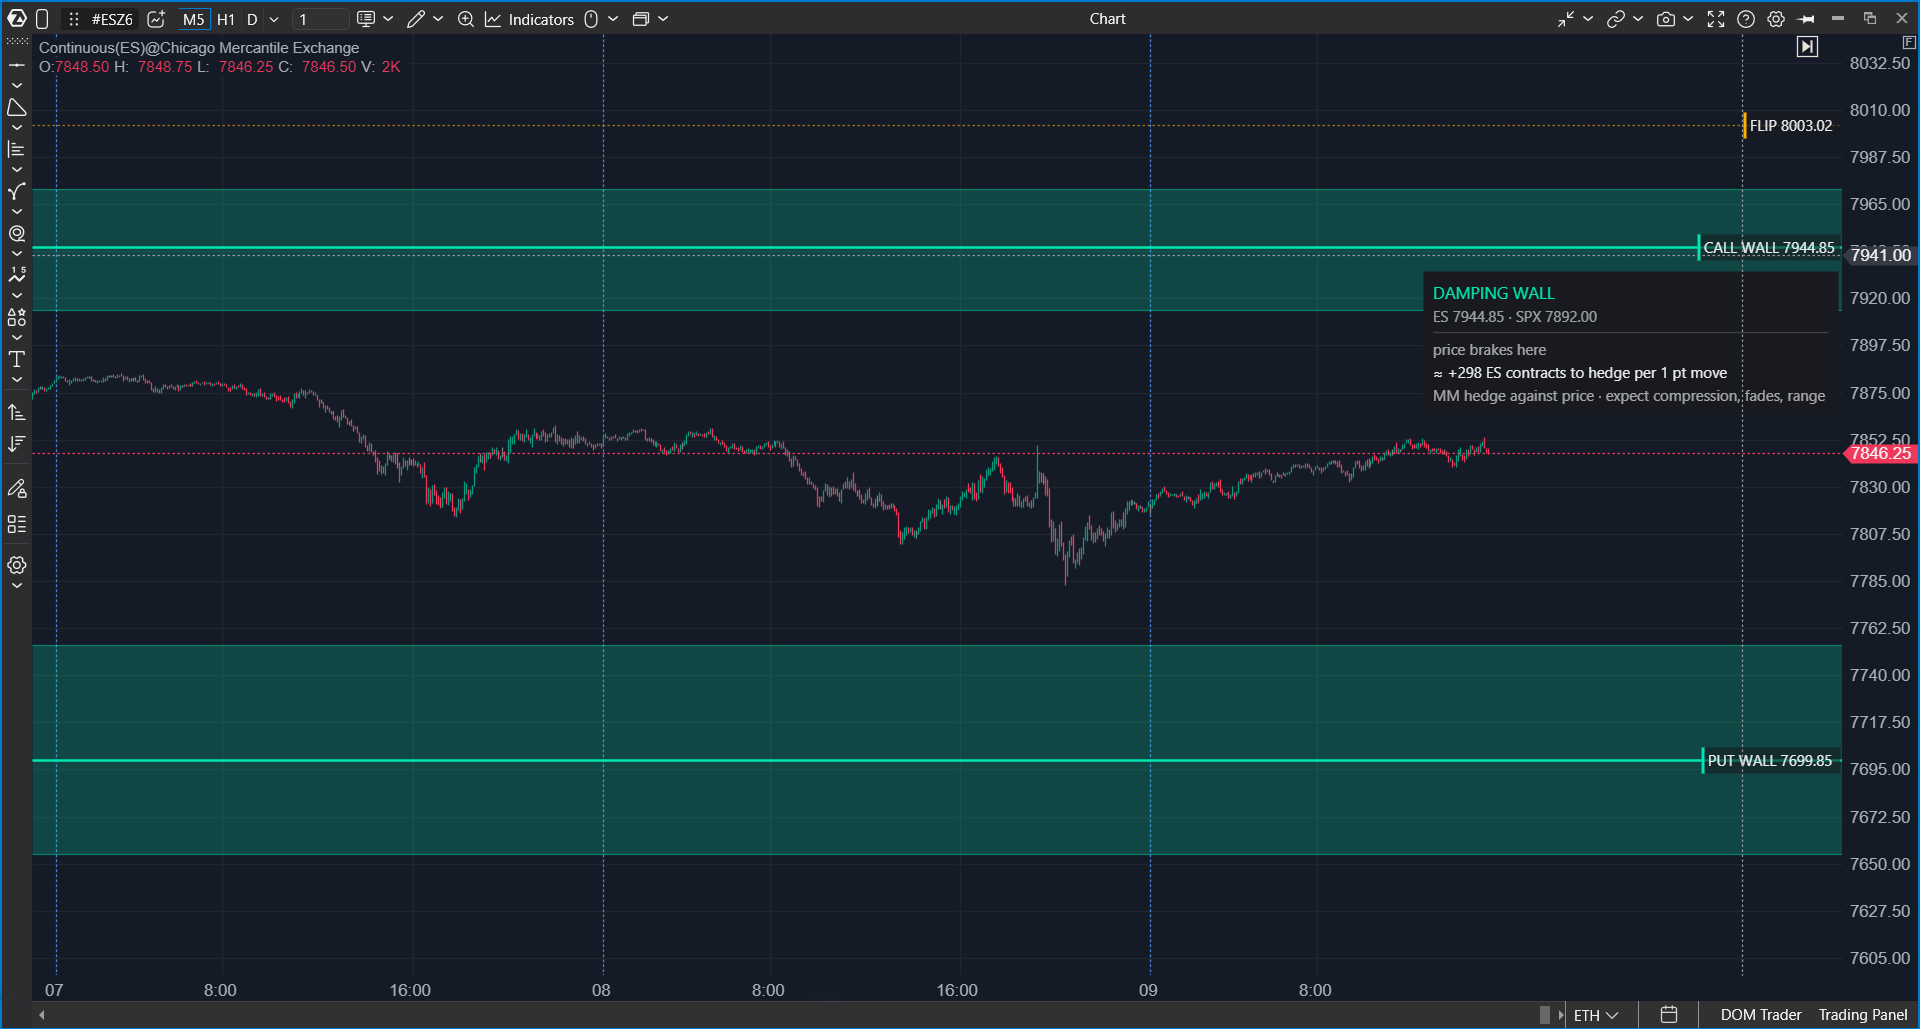
Card over CALL WALL 7944.85: a damping wall. Market makers may need to trade about 298 ES contracts for each point of price movement at this level.
| Card part | What it shows |
| Verdict | DAMPING WALL for walls, AMPLIFYING ZONE for the slippery zone, REGIME BOUNDARY for the flip level, PIN for the pin. |
| Level price | The price on the current chart and the matching SPX level, for example ES 7944.85 · SPX 7892.00. |
| Short verdict | What the level does to price in a few words, for example price brakes here. |
| Main number | How many ES contracts market makers may need to buy or sell for each point of price movement at this level, for example ≈ +298 ES contracts to hedge per 1 pt move. |
| Explanation row | What this means for price, for example MM hedge against price · expect compression, fades, range. |
How to Add the Indicator
- Open an ES, MES, SPY, or US 500 chart.
- Click Indicators on the top panel.
- Select the Options Analytics group or type Options in search.
- Select Options X-Ray: Key Levels.
- Click Add to chart.
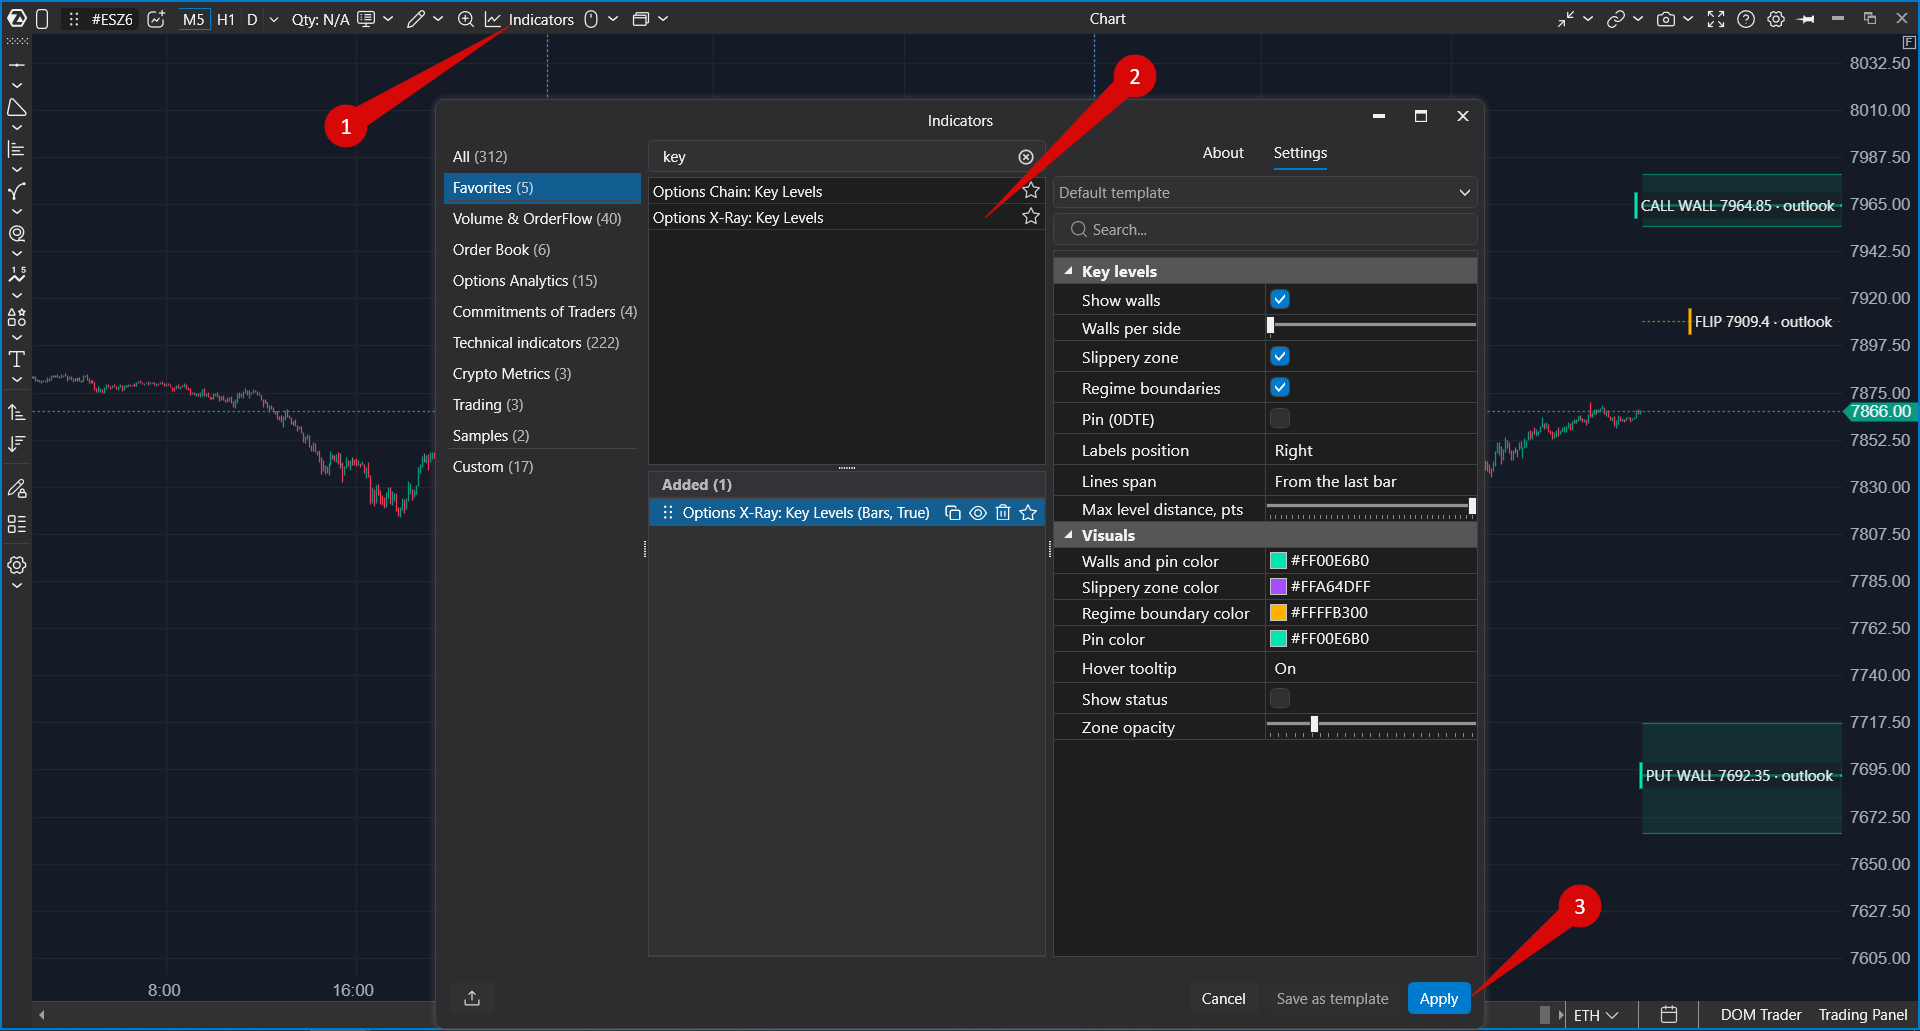
To change settings later, open Indicators again, select the indicator in the Added section, and click Apply.
Settings
| Setting | What it does |
| Walls, Slippery, Flip, Pin | Turn each level type on or off. By default, walls, the slippery zone, and the regime boundary are on, and the pin is off. |
| Walls per side | How many walls to show above and below price: from 1 to 3. The default is 1. |
| Max level distance, pts | Levels farther from price than this distance are not shown. The default is 200 points. A wall that price cannot reach today only adds noise. |
| Label position | Where the labels are drawn: Right (default), Left, or Center. |
| Line extent | Draw lines from the last candle or across the full chart width. |
| Colors | Separate colors for walls, the slippery zone, the regime boundary, and the pin. |
| Zone opacity | Controls the zone fill. The default is 26. At 0, the zones are hidden and only the lines remain. |
| Hover tooltip | Controls the hover card: Off, On (default), or While Ctrl is held. The Ctrl mode keeps the chart clean and shows the card only on demand. |
| Show status | Shows the indicator status line. It is disabled by default. |
How to Work With the Indicator
- Find the nearest walls above and below price. They outline the area where movement is likely to slow down today.
- Check whether price is above or below FLIP. Above it, expect a calmer market and fades. Below it, expect faster moves and follow-through.
- If SLIPPERY is close to price, do not expect price to hold inside that zone. Price may pass through it quickly.
- On expiration days, enable Pin and watch whether price stays close to that strike in the afternoon.
- Confirm entries with tape, clusters, and delta.
To see where the levels come from and how they move during the day, add Options X-Ray: GEX Heatmap or Options X-Ray: Surface Profile.
Troubleshooting
| What happens | What to do |
| The indicator is not in the list | Check whether the Options X-Ray package is enabled in your account. |
| The levels are not drawn, and the chart shows the chip "Options X-Ray: SPX options data · for ES, MES, SPY and US 500 charts only" | The chart instrument is not supported. Open an ES, MES, SPY, or US 500 chart. |
| There is no PIN level | Pin is disabled by default. Turn it on in the settings. |
| A wall disappeared or fewer walls are shown than expected | The wall may be farther from price than Max level distance, pts. Increase the distance or the number of walls per side. |
| The levels moved during the day | This is expected. Positions change, and the levels are recalculated every minute. |
| The label and the card show outlook | The market is closed. The indicator shows a projection for the next session open. |
| The levels differ from Options Chain: Key Levels | This is expected. Options Chain: Key Levels uses daily open interest, while Options X-Ray: Key Levels uses market-maker positioning recalculated every minute. |
| Pin differs from Max Pain on other websites | This is expected. Max Pain counts contracts, while Pin shows where market-maker hedging holds price. |
| Levels look inaccurate, and the status mentions calibration | The chart does not have enough history to map index levels to the chart accurately. Load more days on the chart and enable Show status if needed. |
Was this article helpful?
That’s Great!
Thank you for your feedback
Sorry! We couldn't be helpful
Thank you for your feedback
Feedback sent
We appreciate your effort and will try to fix the article