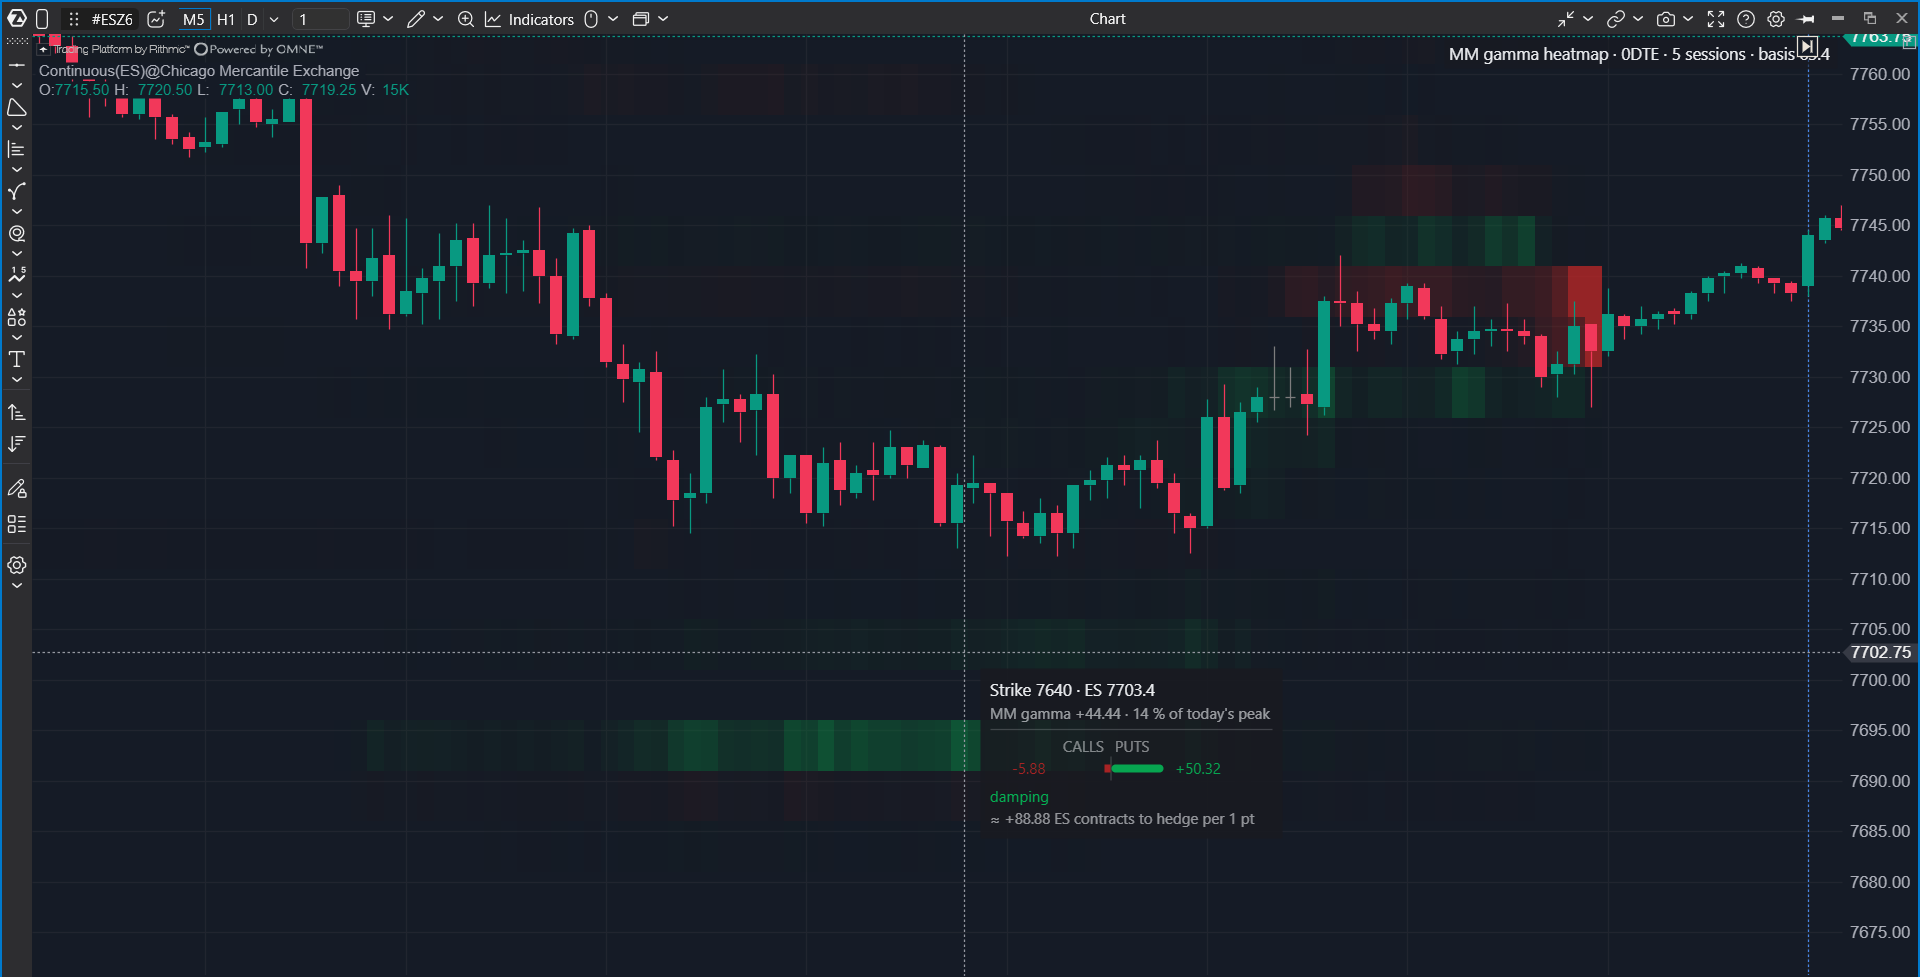
Options X-Ray: Strike Heatmap shows on an ES, MES, SPY, or US 500 chart how the strength of each option strike changed during the session. By default, it shows whether market-maker hedging at each strike is expected to damp or amplify price movement. Each strike is drawn as a horizontal track behind the candles. The brighter the track, the more important the level is at that moment.
The map helps you see when a major level appeared, when it strengthened, and when it disappeared. A level that did not matter in the morning can become the main level of the day by midday.
 Why Use It
A position profile for one moment shows where large levels are now, but it does not show how they developed. A session has a story: levels appear, gain strength, and fade. Strike Heatmap unfolds this story across the chart, with time on the horizontal axis and strikes on the vertical axis.
What the tracks show depends on the Exposure setting.
| Mode | What it shows | Questions it answers |
| Market makers | How market-maker hedging may affect price at each strike. This is the default. | Where may price become sticky or accelerate? When did the wall where price got stuck appear? |
| Participant group | The position of retail traders, professionals, firms, brokers, or all clients together at each strike. | When did firms start building a position at this strike? Are they still holding it? |
Strike Heatmap is not a trading signal. It shows where and when large positions existed. Confirm entries with tape, clusters, and delta.
What You Should Know Before You Start
| Chart | Use an ES, MES, SPY, or US 500 chart. ES and MES work with any specific contract, for example ESZ5. The data is OptionsDepth analytics derived from CBOE market data for S&P 500 index (SPX) options, and it is mapped to the chart automatically. |
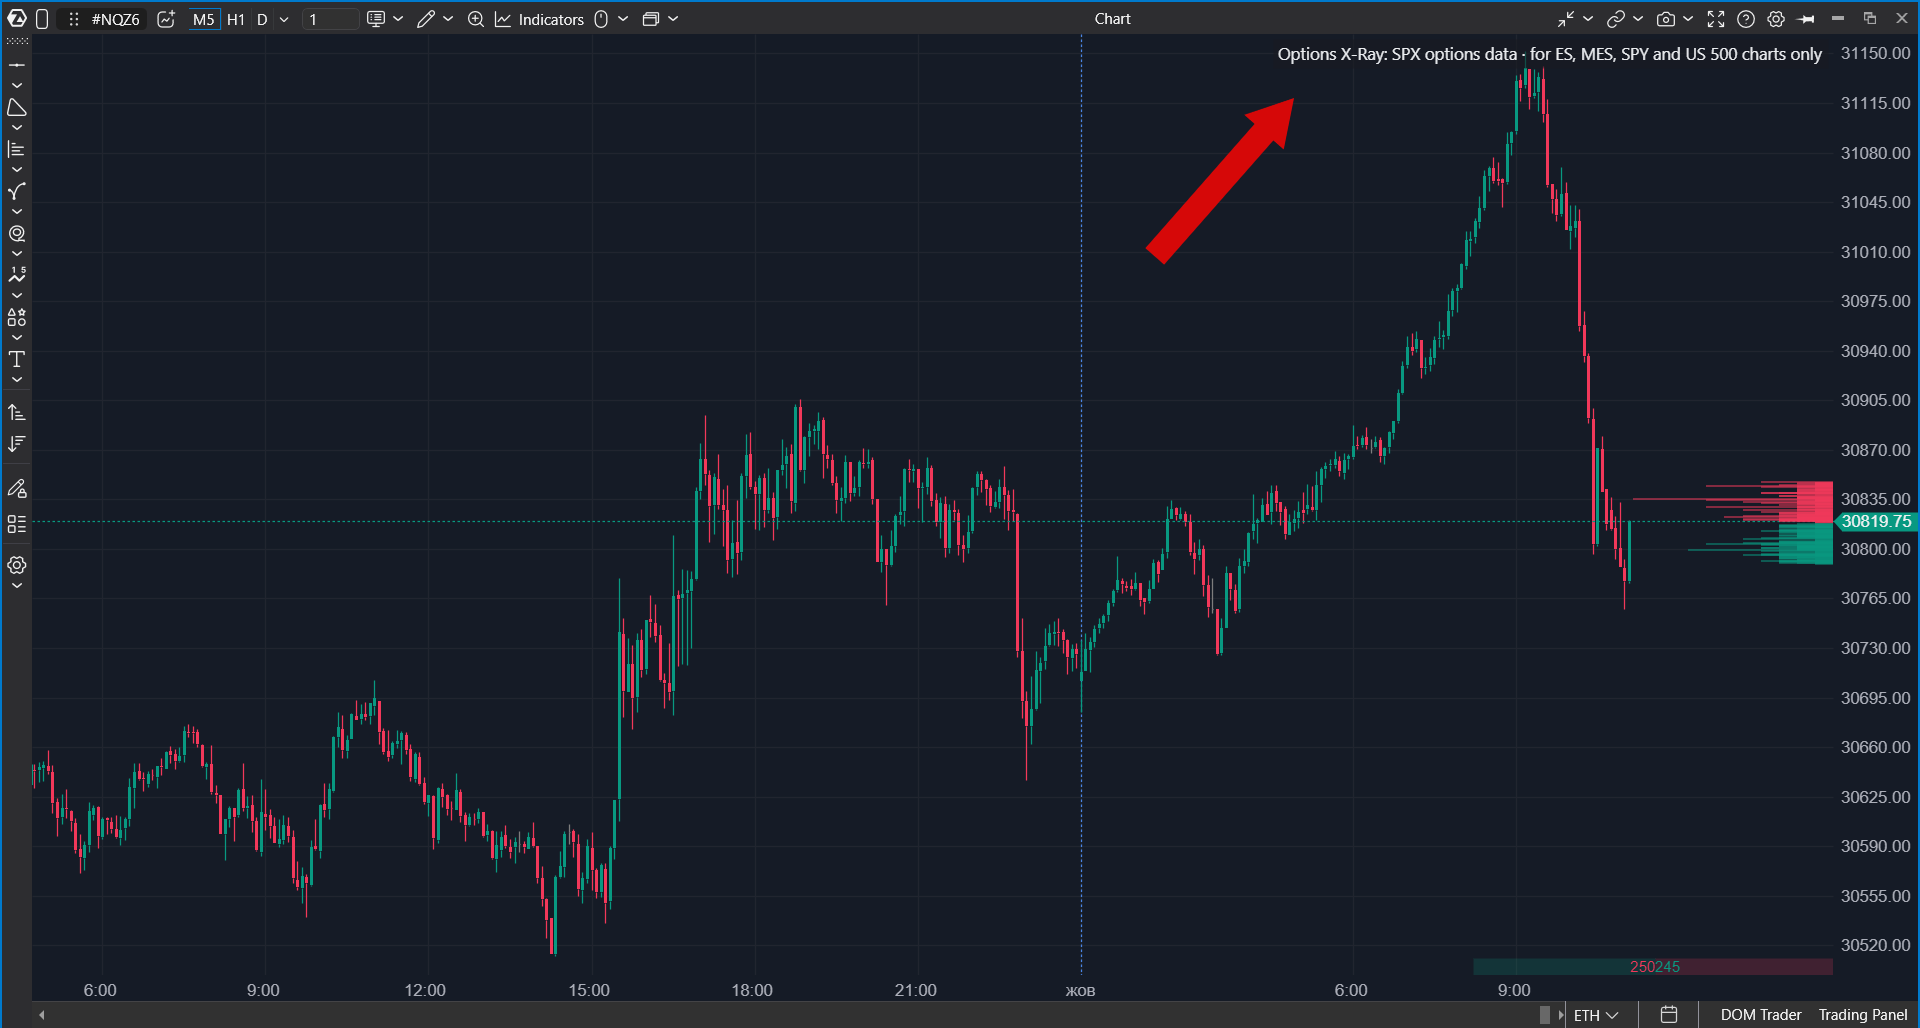
| Other markets | On any other instrument (NQ, oil, gold, individual stocks, crypto) the indicator draws nothing and shows an explanatory chip instead: Options X-Ray: SPX options data · for ES, MES, SPY and US 500 charts only. |
| Update frequency | The data updates once per minute. |
| Units | Values are shown in ES contracts, not option contracts. In Gamma (GEX) — MM mode, the value shows how many ES contracts market makers may need to buy or sell per point of price movement. In Delta (DEX) — MM and participant-group modes, it shows the risk at the strike converted to ES futures exposure. |
| Access | Options X-Ray indicators are part of a separate package. If the indicator is not in the list, check whether the package is enabled in your account. |
| Data | Built on minute-level SPX options positioning analytics derived from CBOE market data. Data & analytics by OptionsDepth. |
This is not open interest. The map shows risk at a strike, not the number of contracts. A far strike with many contracts can look weak here if it has little effect on price. For this reason, levels do not have to match open-interest charts.
How to Read the Map
| Element | Meaning |
| Track | One strike through the session. |
| Brightness | The size of the selected exposure at that strike and time. A bright track is a large level. |
| Color | The sign of the selected value. In Gamma (GEX) — MM mode, it shows whether the level dampens or amplifies price movement. In Charm (CEX) — MM mode, it shows whether market makers may need to sell or buy. In participant-group mode, it shows upside or downside exposure. |
| Track becomes brighter | The level gained strength. |
| Track fades | The level weakened or the options expired. |
Opposite colors mean opposite values, not the same thing. A bright green and a bright red can be equally strong levels, but they have opposite effects.
Exposure: What to Show
The Exposure setting selects which value is drawn on the tracks.
| Value | What it shows |
| Gamma (GEX) — MM | Where market-maker hedging may damp or amplify price movement. This is the default. |
| Delta (DEX) — MM | How many ES futures market makers hold against each strike. |
| Vanna (VEX) — MM | Where market makers may need to trade ES futures if volatility changes. |
| Charm (CEX) — MM | Where market makers may need to trade ES futures simply because time passes. In this mode, colors show direction: red means selling pressure. |
| Participant group position | The position of retail traders, professionals, firms, brokers, or all clients together, without market makers. |
Expirations
The Expirations setting selects which options are used to build the map.
| Value | Options included |
| 0DTE (expiring today) | Options expiring today. This is the default. These options usually hold most positions near the current price. |
| Next expiration | The nearest expiration date after today. |
| E+2, E+3, E+4 | The second, third, and fourth future expiration dates. Holiday weeks can shift the dates. |
| OPEX (monthly) | The nearest monthly option series, usually containing large accumulated positions. |
| End of month | The last expiration date in the calendar month. |
| This week (to Friday) | All options through Friday, including today's options. |
| Rest of week (E+1..Fri) | All options through Friday except today's options. On Friday, this can be empty. |
Compare 0DTE with Rest of week to separate today's levels from levels that may remain after today's close. To see midweek positioning, check expiration dates by day.
Tooltip Card
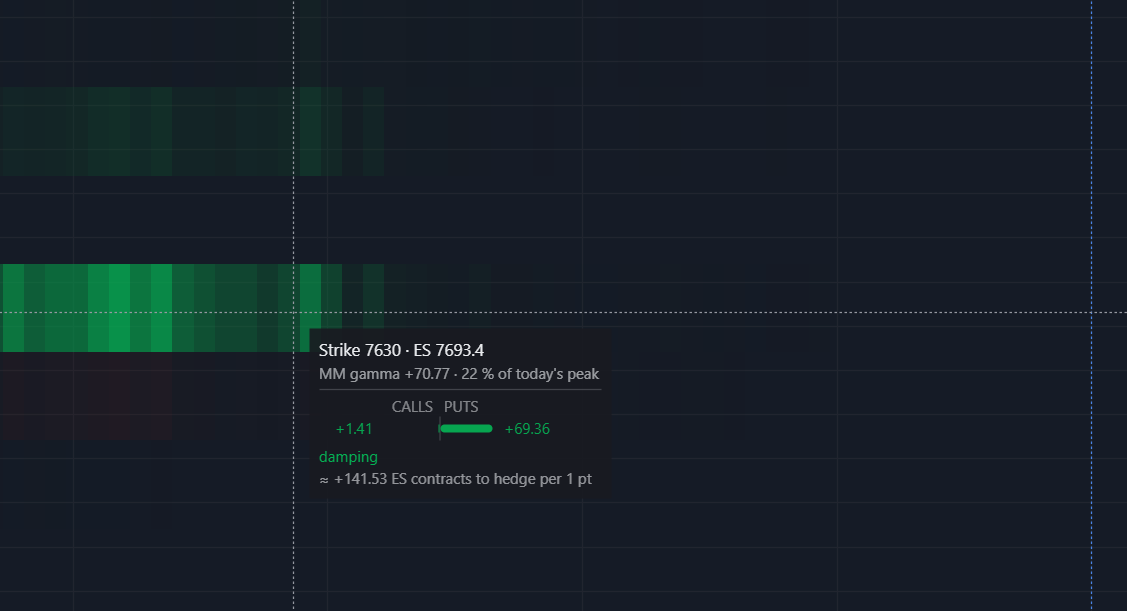
Hover over a track to open a strike card.
| Card part | What it shows |
| CALLS / PUTS | How much of the value at the strike comes from call options and how much comes from put options. |
| Colored conclusion | What the level does to price, for example whether it dampens or amplifies movement. |
How to Add the Indicator
- Open an ES, MES, SPY, or US 500 chart.
- Click Indicators on the top panel.
- Select the Options Analytics group or type Options in search.
- Select Options X-Ray: Strike Heatmap.
- Click Add to chart.
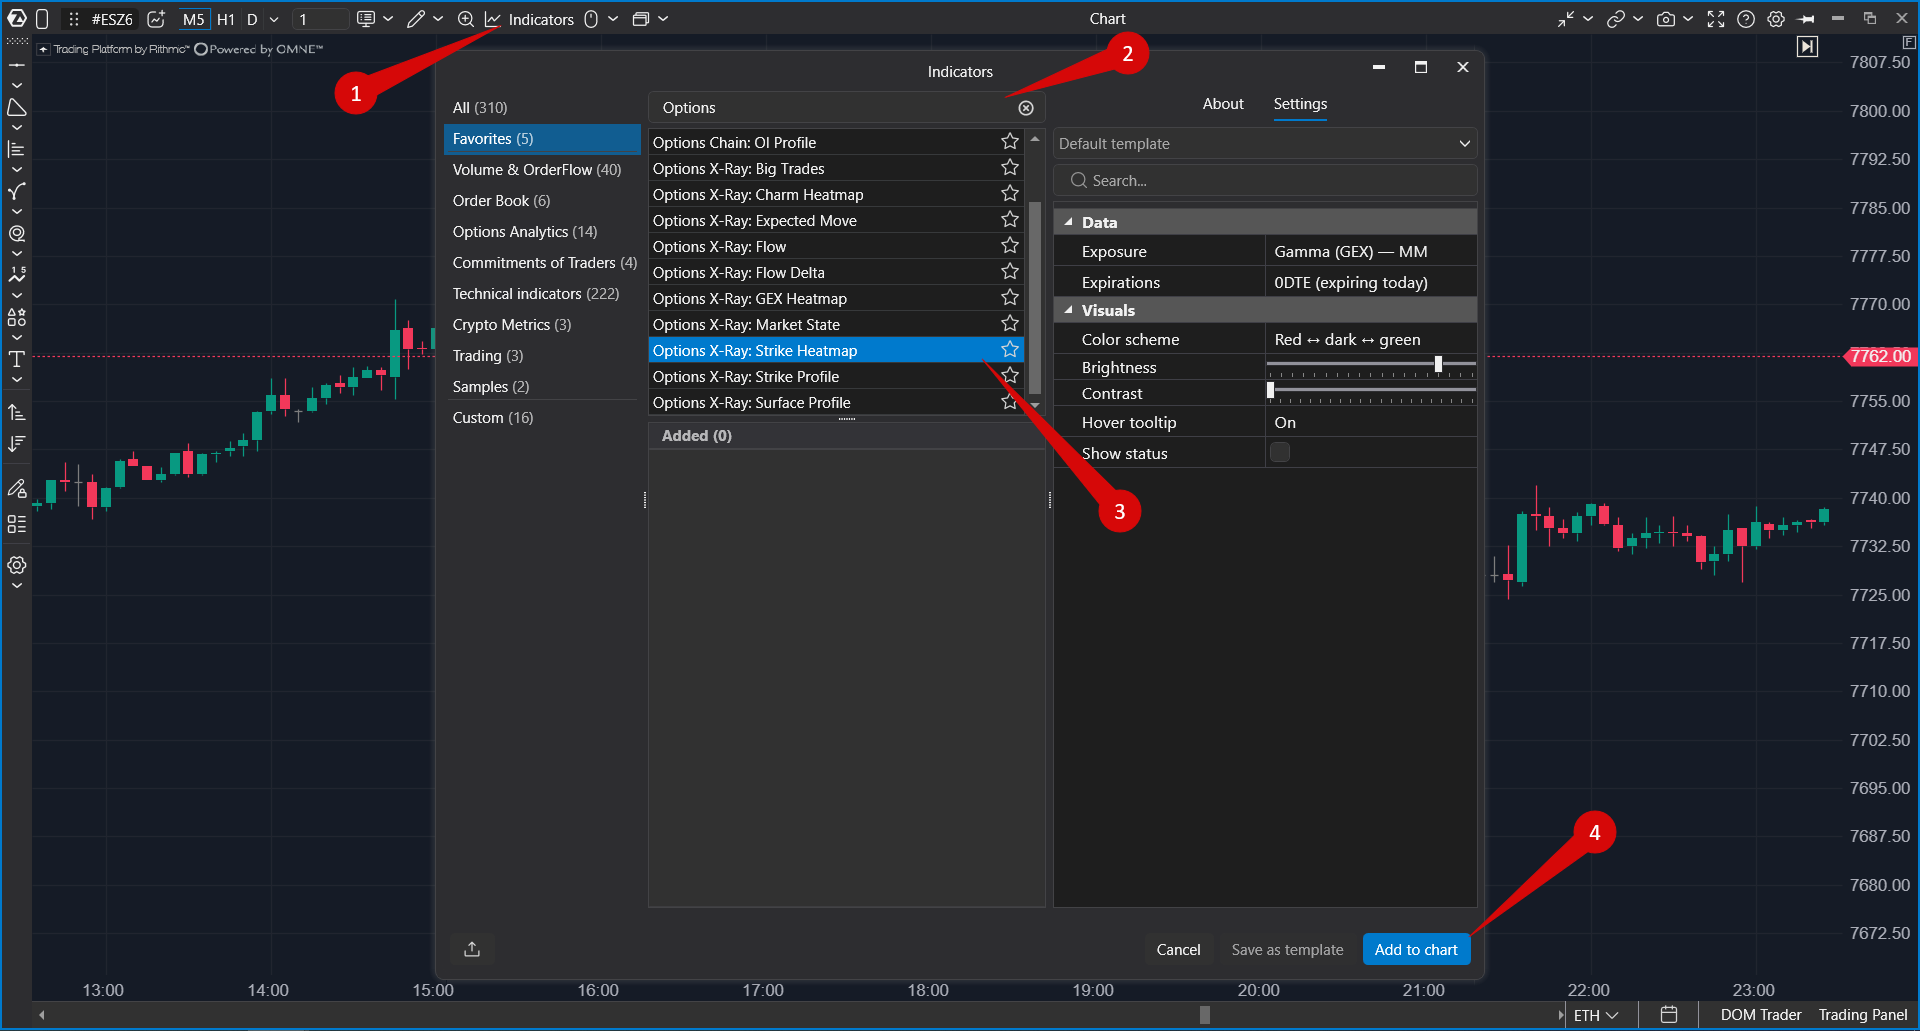 To change settings later, open Indicators again, select the indicator in the Added section, and click Apply.
Settings
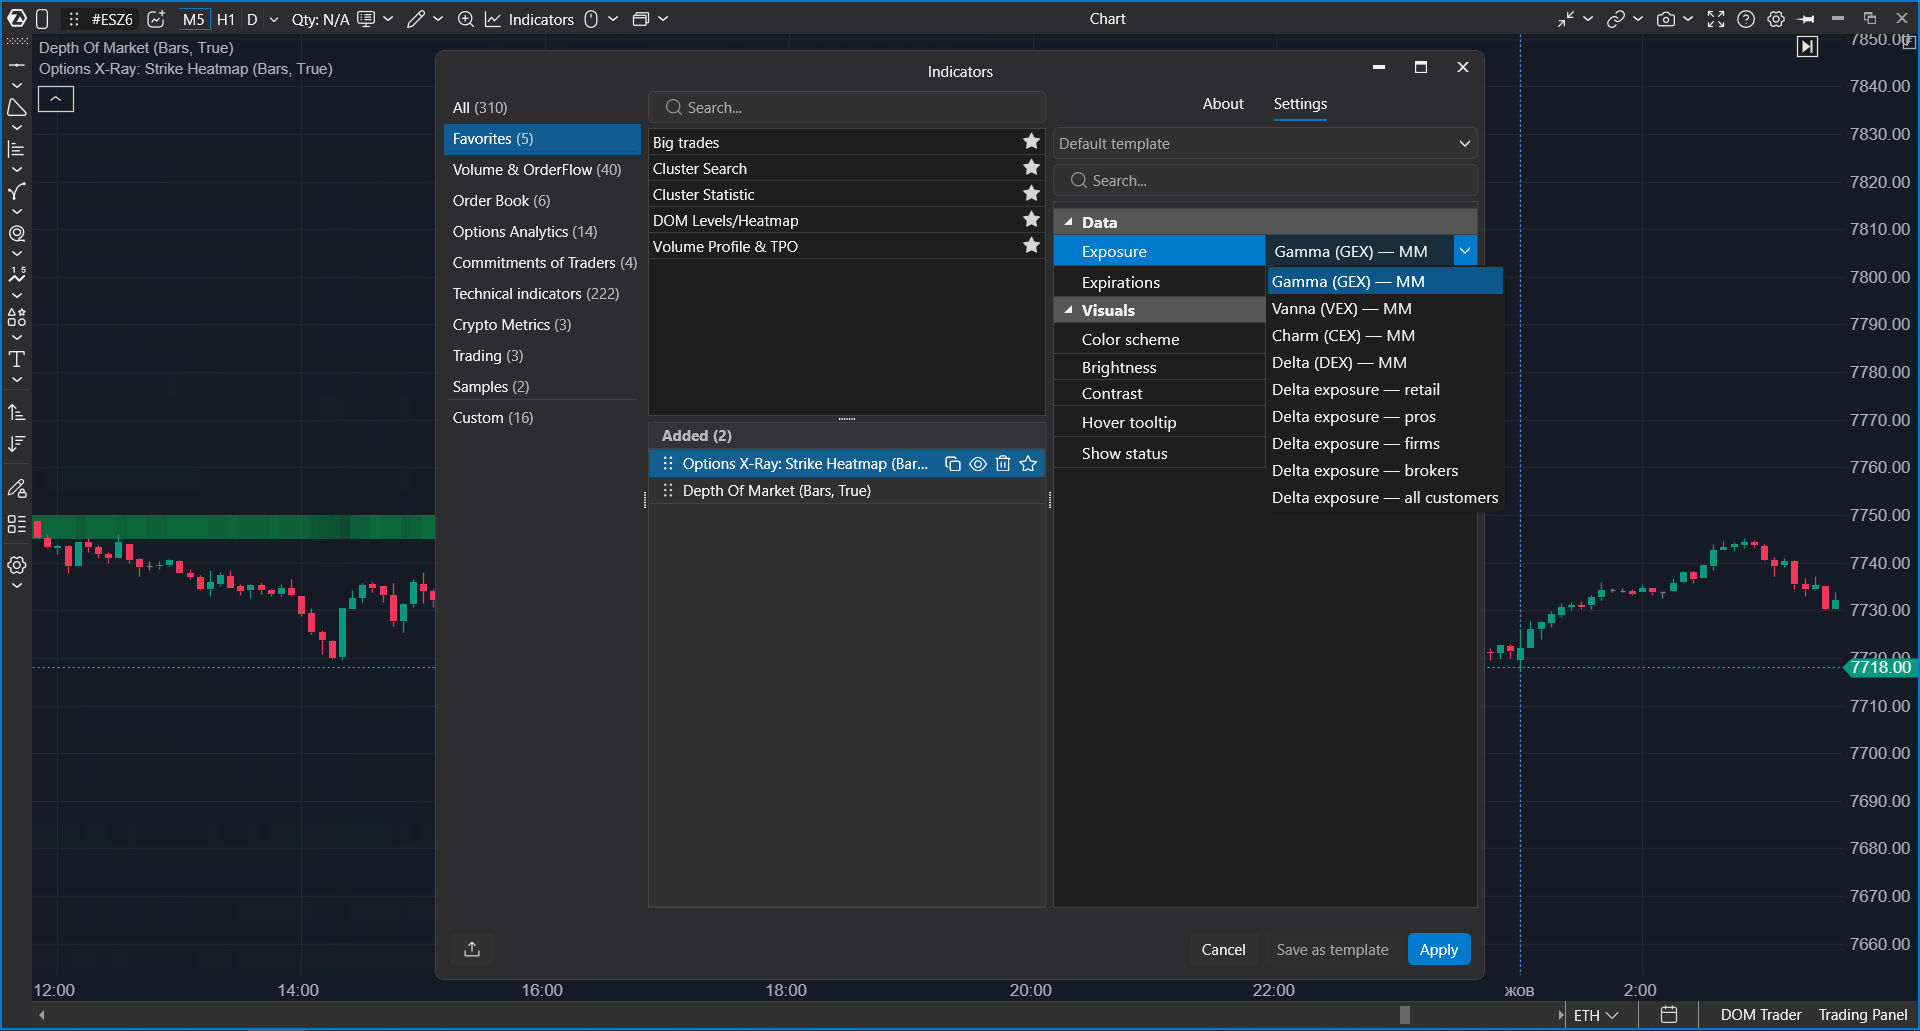
| Setting | What it does |
| Exposure | Selects which value is drawn. The default is Gamma (GEX) — MM. |
| Expirations | Selects which options are included. The default is 0DTE (expiring today). |
| Color scheme | Controls map colors. The default is red to light to green. |
| Brightness | Controls overall map brightness. The default is moderate so tracks do not cover candles. |
| Contrast | Controls how strongly weak and strong strikes differ. The default is high. |
| Hover tooltip | Controls the hover card: Off, On (default), or While Ctrl is held. The Ctrl mode keeps the chart clean and shows the card only on demand. |
| Show status | Shows the indicator status line in the chart corner. It is disabled by default. |
How to Work With the Indicator
Strike Heatmap pairs with Options X-Ray: Strike Profile (GEX/DEX/VEX/CEX). They show the same type of data in different ways.
| Indicator | When it is more useful |
| Strike Profile | When you need an exact snapshot at a specific moment, with numeric values, or a day-by-day comparison of several sessions. |
| Strike Heatmap | When you need the session story: where levels appeared, strengthened, and disappeared. |
- Find the brightest tracks near the current price.
- Check when they appeared: are they long-standing levels or fresh levels?
- Look at how price behaved earlier in the day when it approached these tracks.
- Switch Exposure to a participant group to see who is behind the level.
- Use Strike Profile for exact current numbers.
Troubleshooting
| What happens | What to do |
| The indicator is not in the list | Check whether the Options X-Ray package is enabled in your account. |
| The map is not drawn, and the chart shows the chip "Options X-Ray: SPX options data · for ES, MES, SPY and US 500 charts only" | The chart instrument is not supported. Open an ES, MES, SPY, or US 500 chart. |
| The map is not drawn on a supported chart | During weekends and holidays there is no new data, but previous sessions should still be displayed. |
| Rest of week is empty | If today is Friday, this is expected: there are no later expirations left in the week. |
| The picture changed sharply on Friday morning | If 0DTE is selected and it is the third Friday of the month, monthly options may have expired in the morning and the indicator switched to weekly options. This is expected. |
| Levels do not match open-interest charts | This is expected. The heatmap shows risk at the strike, not the number of contracts. |
| Levels look inaccurate, and the status mentions calibration | The chart does not have enough history to map index levels to the chart accurately. Load more days on the chart and enable Show status if needed. |
Was this article helpful?
That’s Great!
Thank you for your feedback
Sorry! We couldn't be helpful
Thank you for your feedback
Feedback sent
We appreciate your effort and will try to fix the article