Options GEX Profile shows gamma exposure by strike and highlights areas where market-maker hedging may dampen or amplify price movement.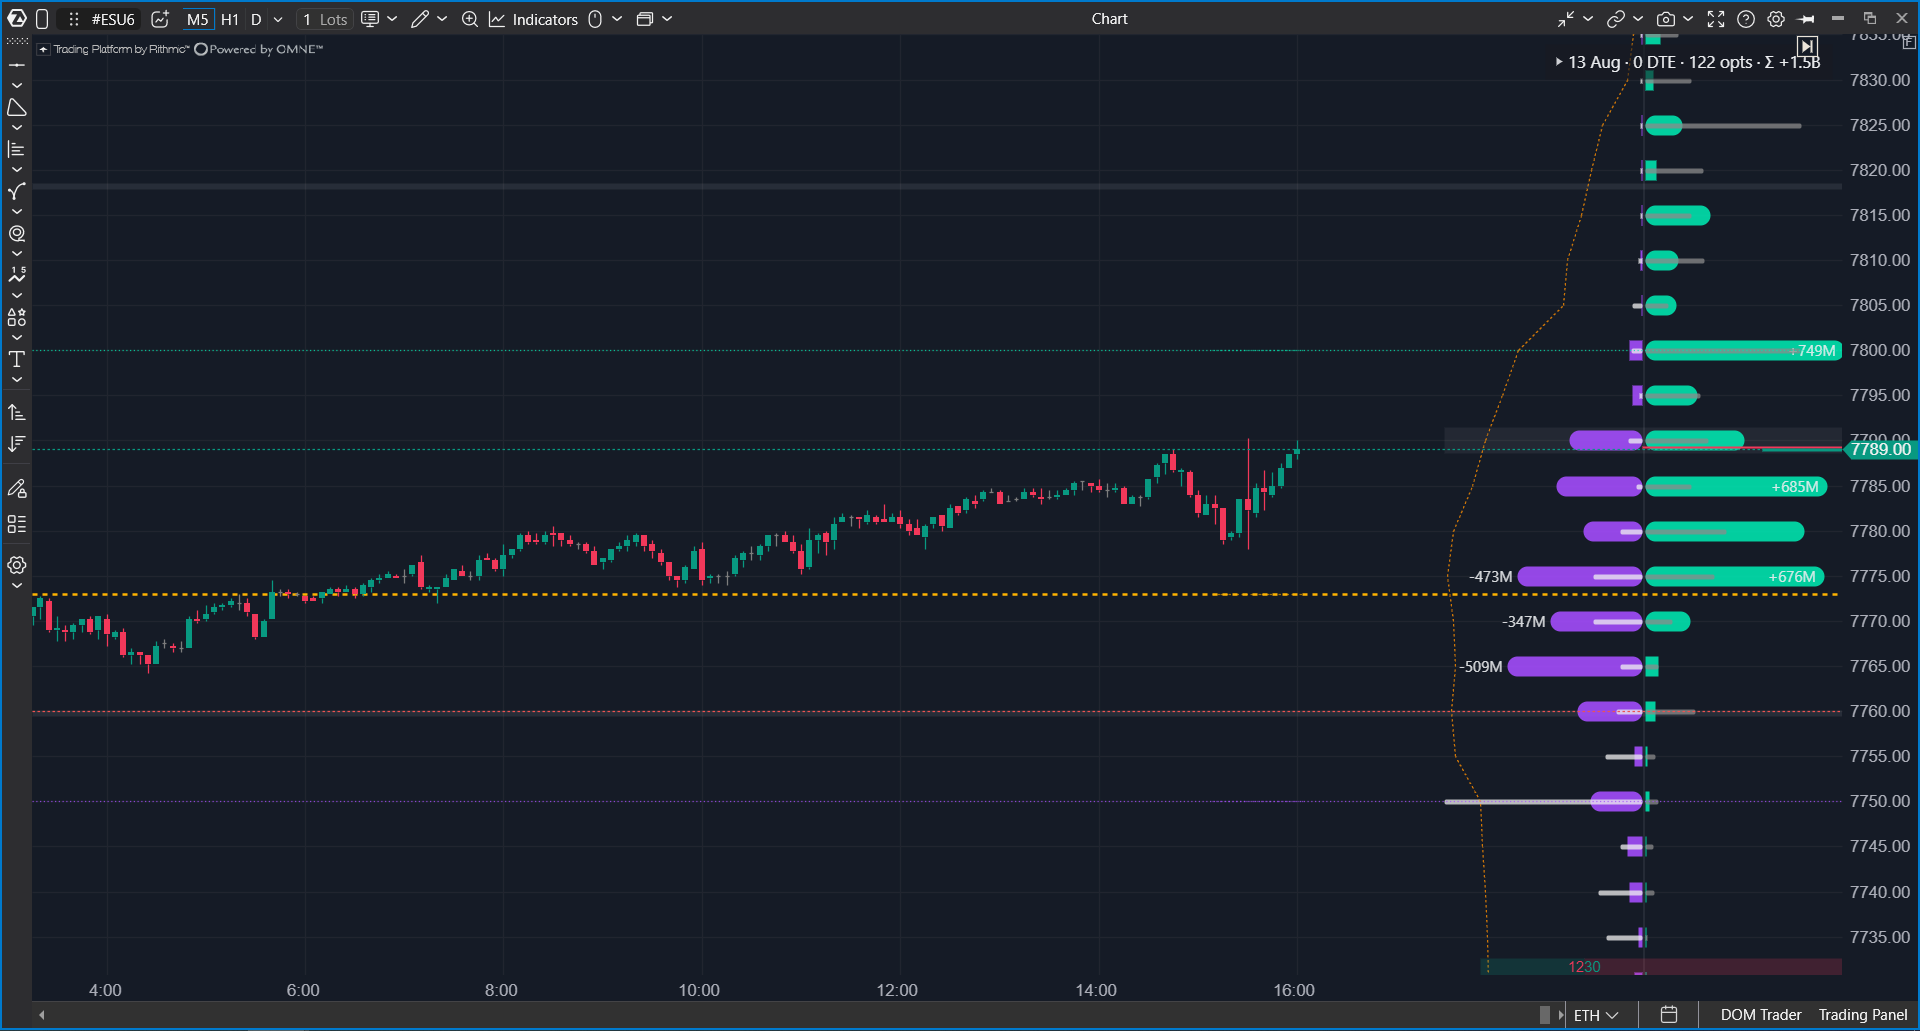
The indicator is intended for traders who want to analyze options positioning together with price action, volume, and order flow on the underlying instrument chart.
Before you start
Make sure that your connected data provider supports options and provides options data for the selected underlying instrument. Data availability depends on the provider, account permissions, instrument, and market data subscription. Options data can be available through Interactive Brokers or Rithmic, depending on your setup.
How option analytics indicators work
Option analytics indicators subscribe to a range of option strikes around the current underlying price for the selected expiration series. ATAS receives live market data such as bid, ask, last price, open interest, and day volume.
Values such as implied volatility and Greeks are calculated in ATAS from the available option prices. The indicators then aggregate the data by strike, expiration, side, or time interval and display the result on the chart.
What Options GEX Profile shows
The indicator displays a gamma exposure profile by strike. Positive gamma is shown on one side of the axis, and negative gamma is shown on the other side.
The profile can also include key levels such as Zero Gamma, walls, Max Pain, Expected Move zones, and a cumulative line.
Why it is useful
Gamma exposure helps describe the market regime. In a positive gamma environment, hedging activity can dampen price movement because hedgers often trade against the move. In a negative gamma environment, hedging activity can amplify movement because hedgers may trade in the direction of the move.
Zero Gamma marks the area where the regime can change. Above it, range-bound behavior may be more likely. Below it, directional movement may become more active.
How it works
For each option contract, ATAS calculates gamma from live option data. The strike contribution is calculated from gamma, position size, contract multiplier, and underlying price. Calls and puts use the standard sign convention for gamma exposure.
The cumulative line shows how exposure accumulates across strikes. Options GEX Profile and Options Key Levels use consistent level logic, so their walls should match when the same input settings are used.
Interactive legend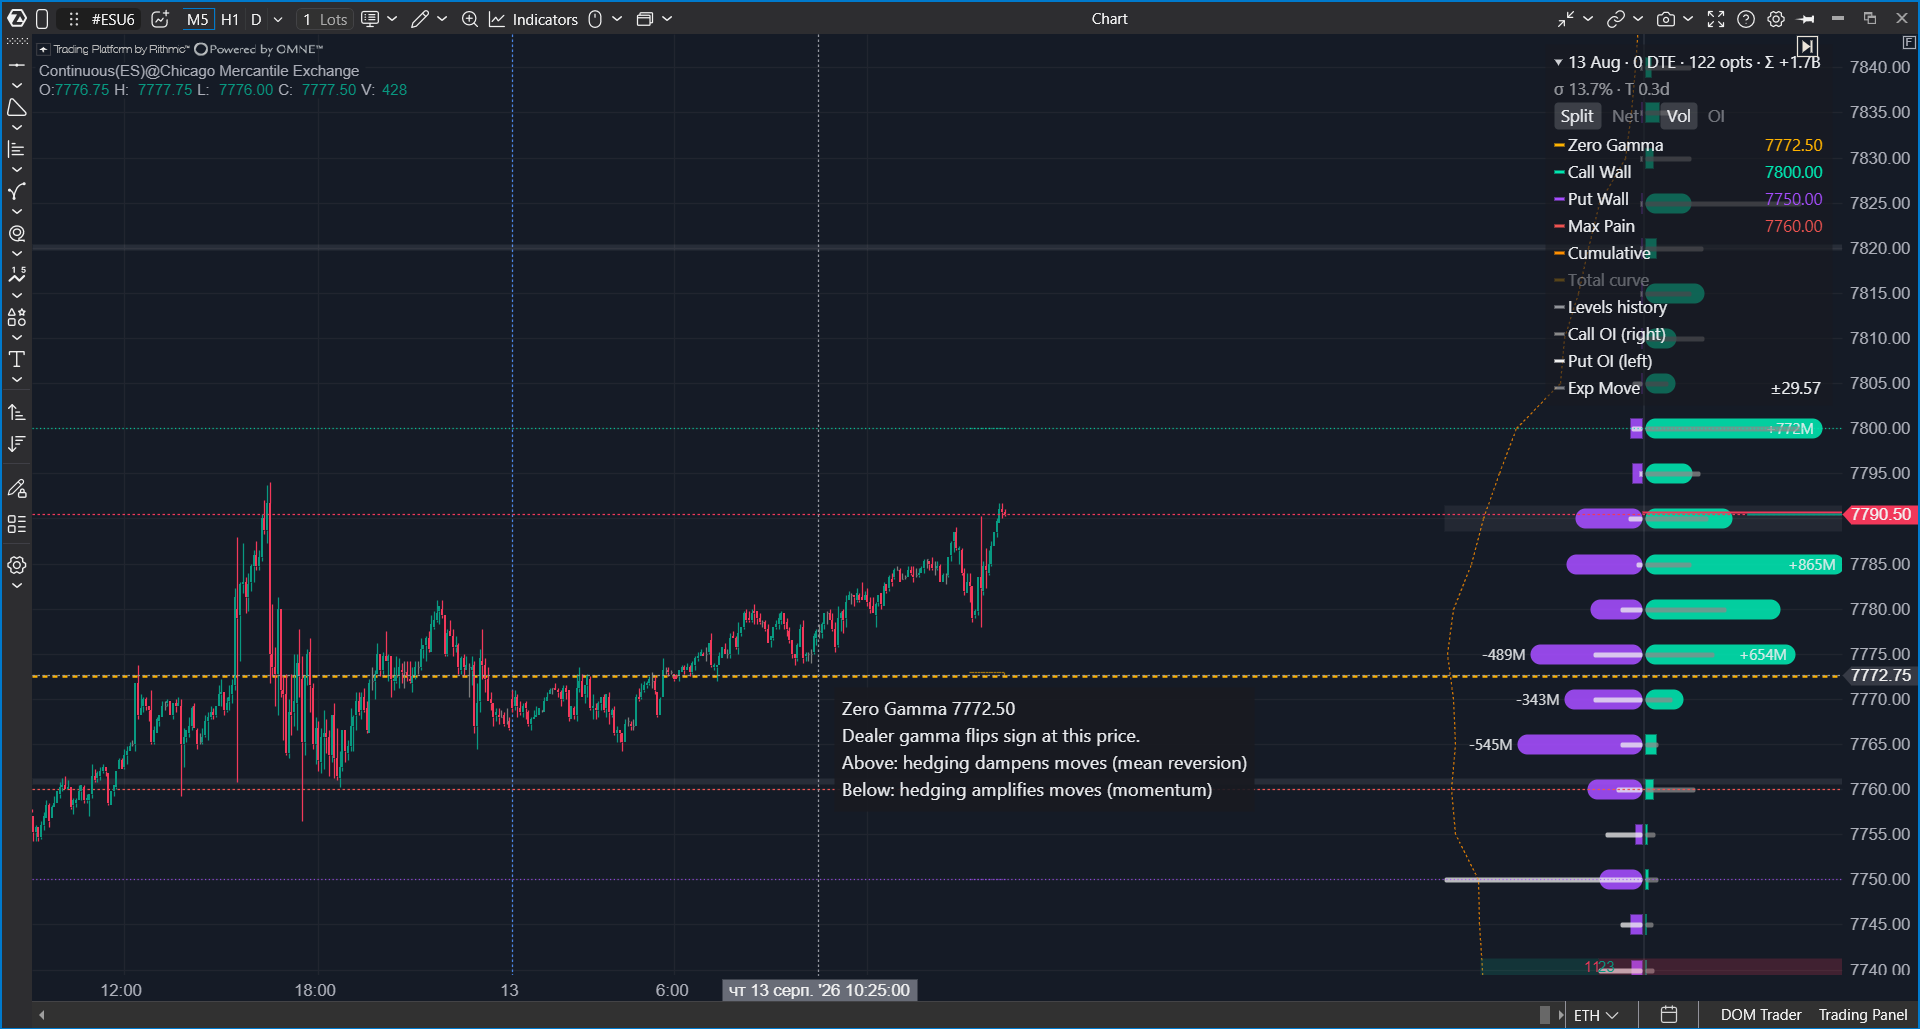
The indicator can show an interactive legend on the chart. Depending on the configuration, it can be used to switch histogram view, source, and overlay visibility.
- Split / Net switches between separate call and put bars and a net profile.
- Vol / OI switches between volume-based and open interest-based source modes.
- Overlay rows can show or hide Zero Gamma, walls, Max Pain, cumulative line, levels history, OI underlay, and Expected Move zones.
- Hovering over a level or profile row shows a tooltip with detailed values.
Key elements
| Element | Meaning |
|---|---|
| Zero Gamma | The area where the gamma regime changes. A break through this level can change the character of the session. |
| GEX bars | Gamma exposure strength by strike, displayed in dollars per 1% underlying move. |
| Walls | Strikes with the strongest positive or negative gamma exposure. Walls are always calculated from open interest, so switching Source between Day Volume and Open Interest changes the bars but leaves the wall levels unchanged. |
| OI underlay | Open interest context shown under or over the GEX bars. |
| Cumulative GEX | A cumulative exposure line across strikes. |
| Levels history | Shows how Zero Gamma and wall levels moved during the session after the indicator was added. |
| Expected Move zones | Shows the expected move area together with the GEX profile. |
Common Data settings
| Setting | Description |
|---|---|
| Expiration | Selects which expiration series is analyzed. Auto (nearest) uses the nearest available expiration and switches to the next series after expiration. |
| Aggregate nearest series | Combines the nearest expiration series into one view when the indicator supports series aggregation. |
| Strikes per side | Defines how many strikes above and below the current price are included in the calculation. |
| Wide range (sparse) | When the requested strike window does not fit the available subscription budget, which typically happens with two or three expiration series, the indicator subscribes to every second strike instead of every one. This roughly doubles the price range the profile covers, but strike-by-strike open interest detail becomes approximate, because the skipped strikes are not subscribed at all. Turn it on when you need the wider picture, and off when exact per-strike values matter. |
Settings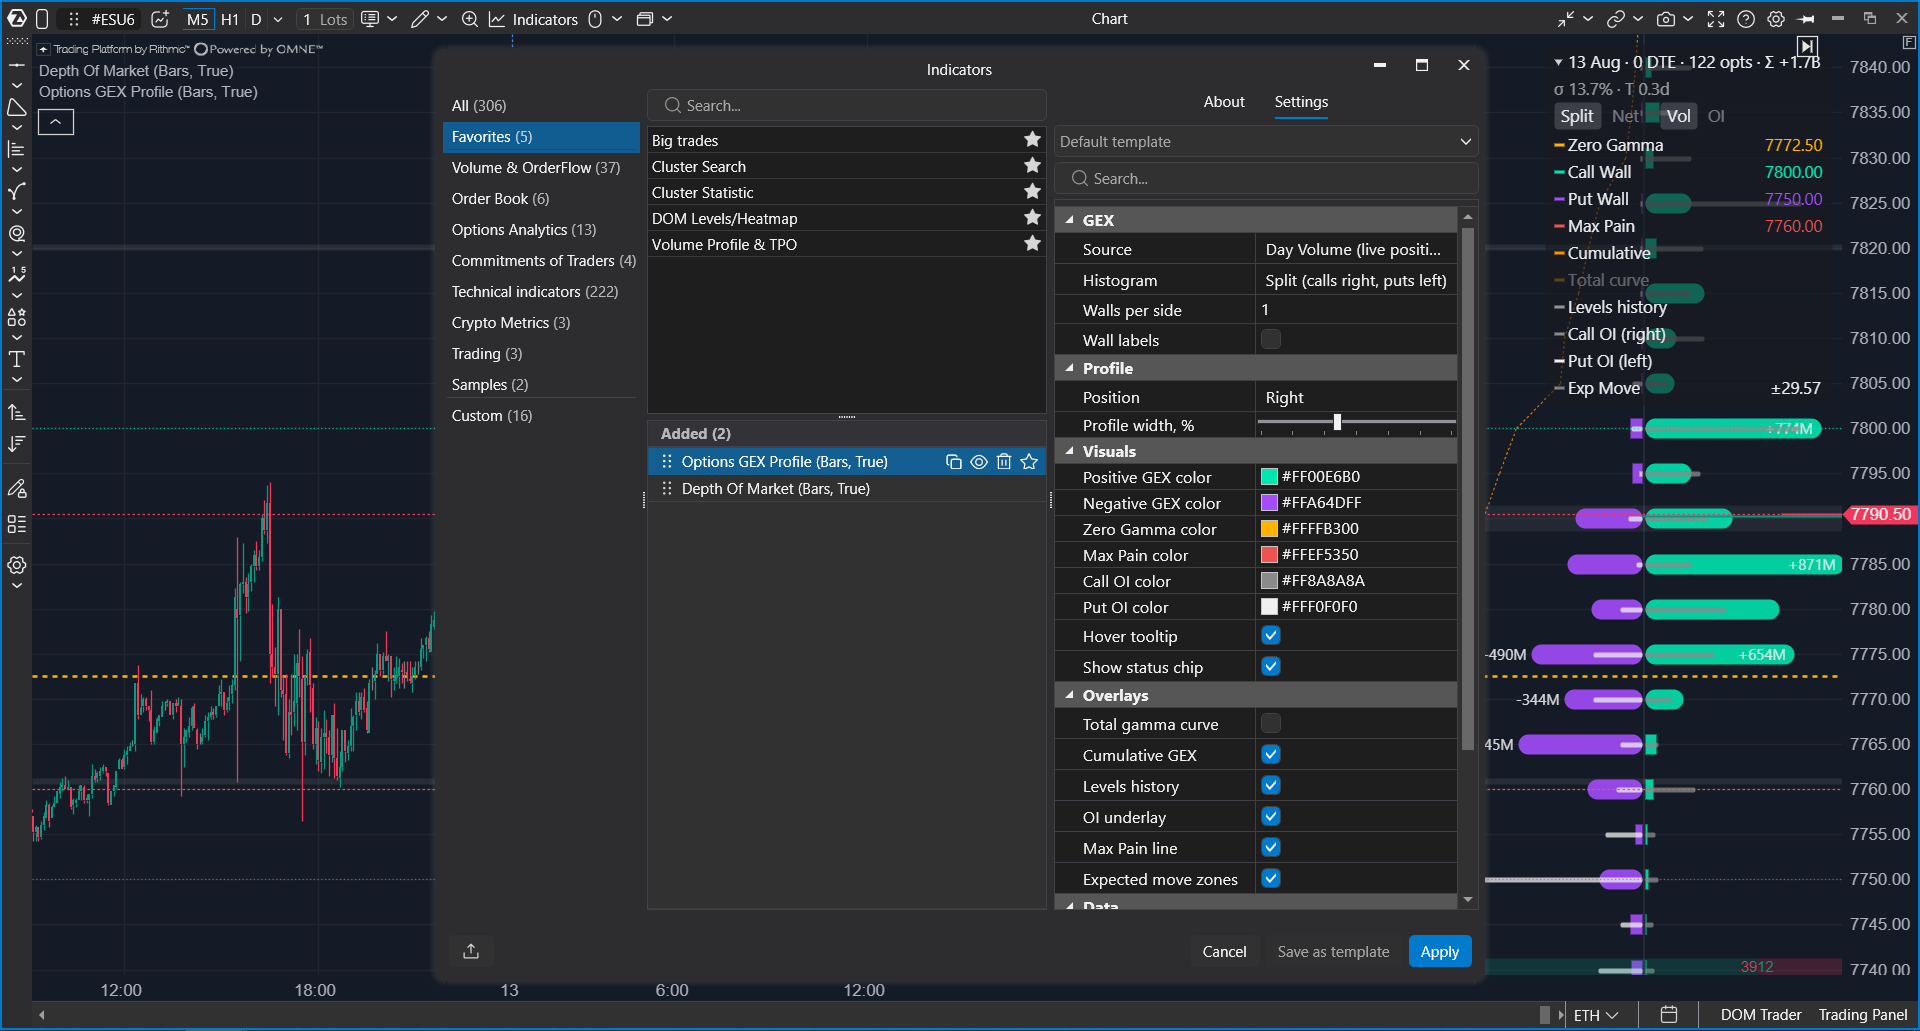
| Group | Setting | Description |
|---|---|---|
| Data | Expiration, Aggregate nearest series, Strikes per side, Wide range | Defines the analyzed expiration and strike range. |
| GEX | Source | Day Volume calculates gamma exposure from current session volume. Open Interest uses accumulated positions. The setting affects the GEX bars only: walls, Zero Gamma and the levels shared with Options Key Levels are always open-interest based, so that both indicators name the same strikes. |
| GEX | Histogram | Split shows calls and puts separately. Net shows one net bar per strike. |
| GEX | Walls per side, Wall labels | Controls highlighted wall levels and their compact labels. |
| Overlays | Total gamma curve, Cumulative GEX, Levels history, OI underlay, Max Pain line, Expected Move zones | Controls which additional elements are drawn over the GEX profile. |
| Profile | Position and Profile width, % | Controls the side and width of the profile. |
| Visuals | Colors, tooltip, status chip | Controls positive and negative GEX colors, Zero Gamma, Max Pain, call and put OI colors, tooltip, and status chip. |
Status chip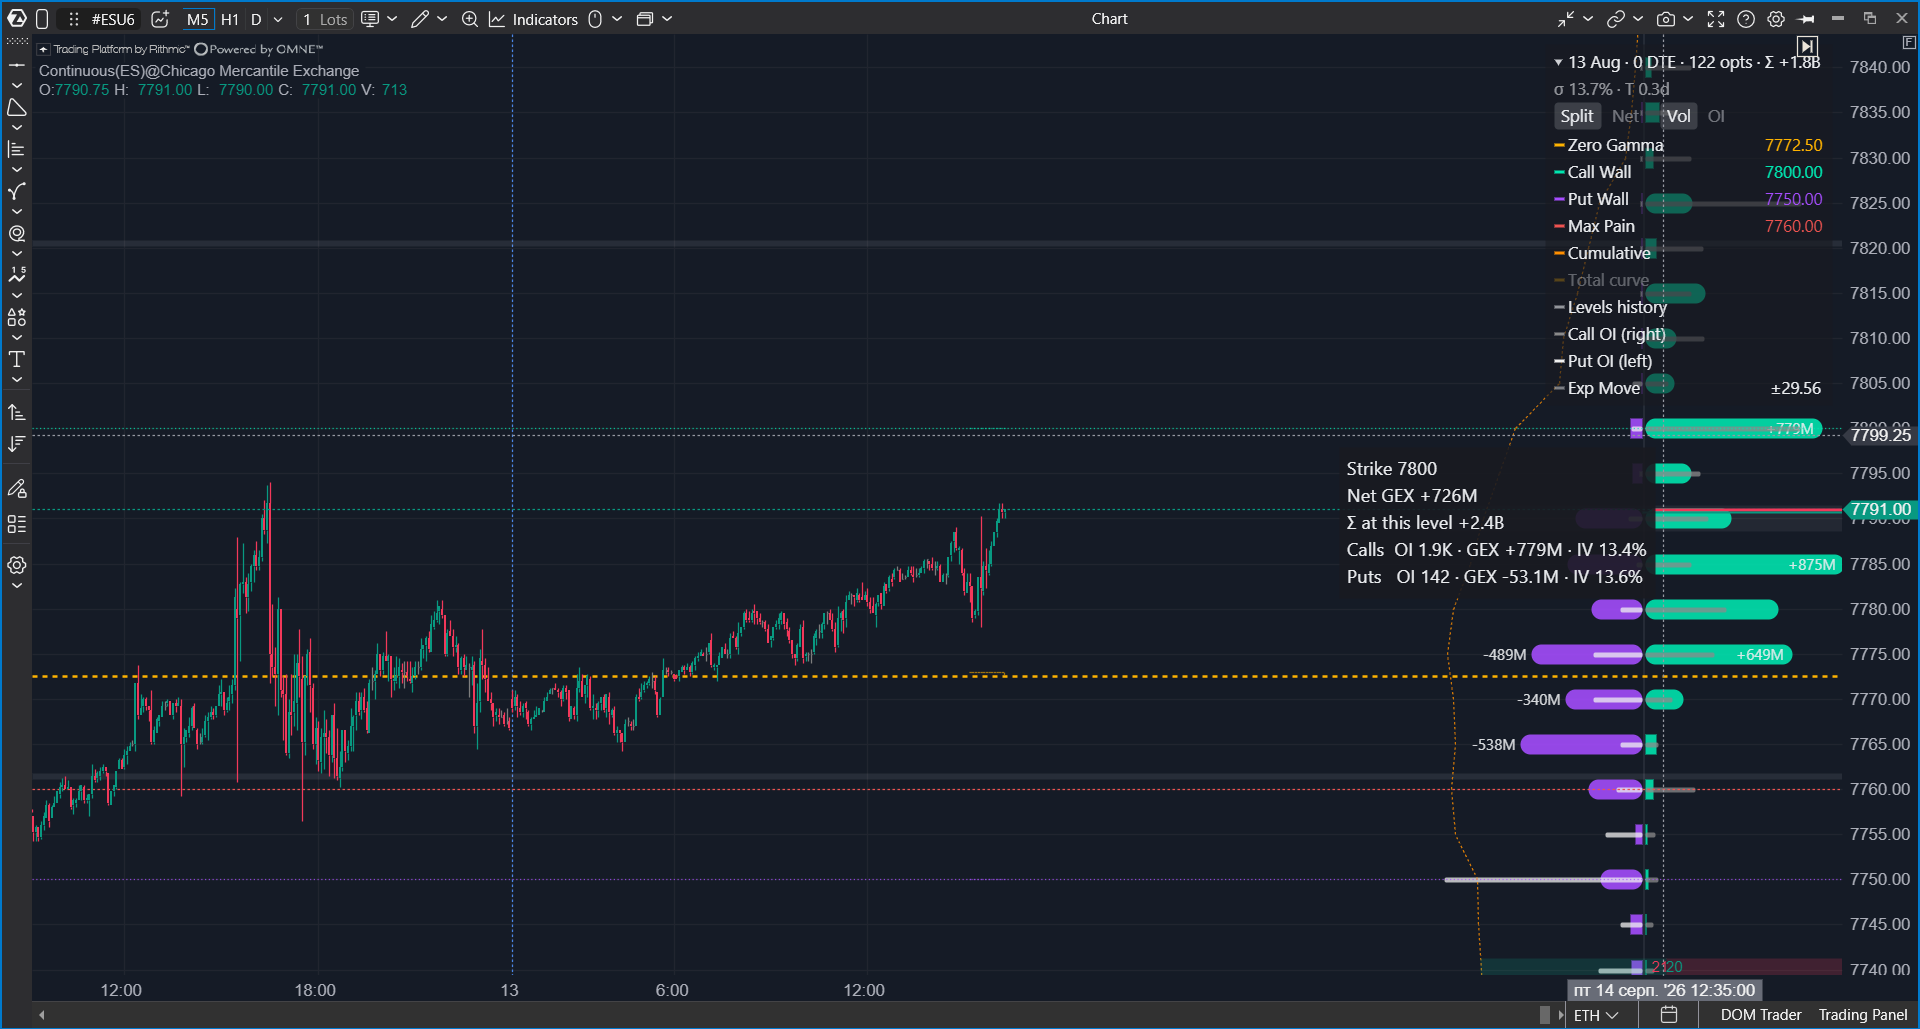
The status chip shows the selected expiration, days to expiration, and the number of subscribed option contracts. It can also show warm-up progress or connection warnings.
Practical recommendations
- Use Open Interest source to analyze structural exposure and Day Volume source to focus on current-session activity.
- Use Split view to compare call and put contribution. Use Net view to see the combined profile by strike.
- Treat Zero Gamma as a regime reference, not as a standalone trade signal.
- Compare GEX walls with Options Key Levels when both indicators use the same expiration and strike settings.
- Gamma exposure is an analytical model of likely market-maker hedging behavior. It is not a direct view of any participant's actual book.
Frequently asked questions
Why does the indicator need time to warm up?
The indicator has to subscribe to multiple option contracts and collect enough quotes for the selected strike and expiration range.
Why do values differ from other services?
Different tools may use different data sources, expiration filters, strike ranges, open interest update timing, implied volatility methods, gamma models, or index-to-futures mapping rules.
Why does the picture start from the moment the indicator was added?
The indicator works with currently available options data. Some intraday visuals start collecting data after they are added to the chart, so they may not reconstruct everything that happened earlier in the session.
What should I check if the indicator shows no data?
Check that your connection provides options data for the selected underlying instrument, that the required market data subscription is active, and that the selected expiration range contains available option contracts.
Related articles
- Indicator settings window
- Indicators Navigation on Chart
Was this article helpful?
That’s Great!
Thank you for your feedback
Sorry! We couldn't be helpful
Thank you for your feedback
Feedback sent
We appreciate your effort and will try to fix the article