Options Key Levels calculates important option-based levels and draws them as horizontal lines on the chart of the underlying instrument.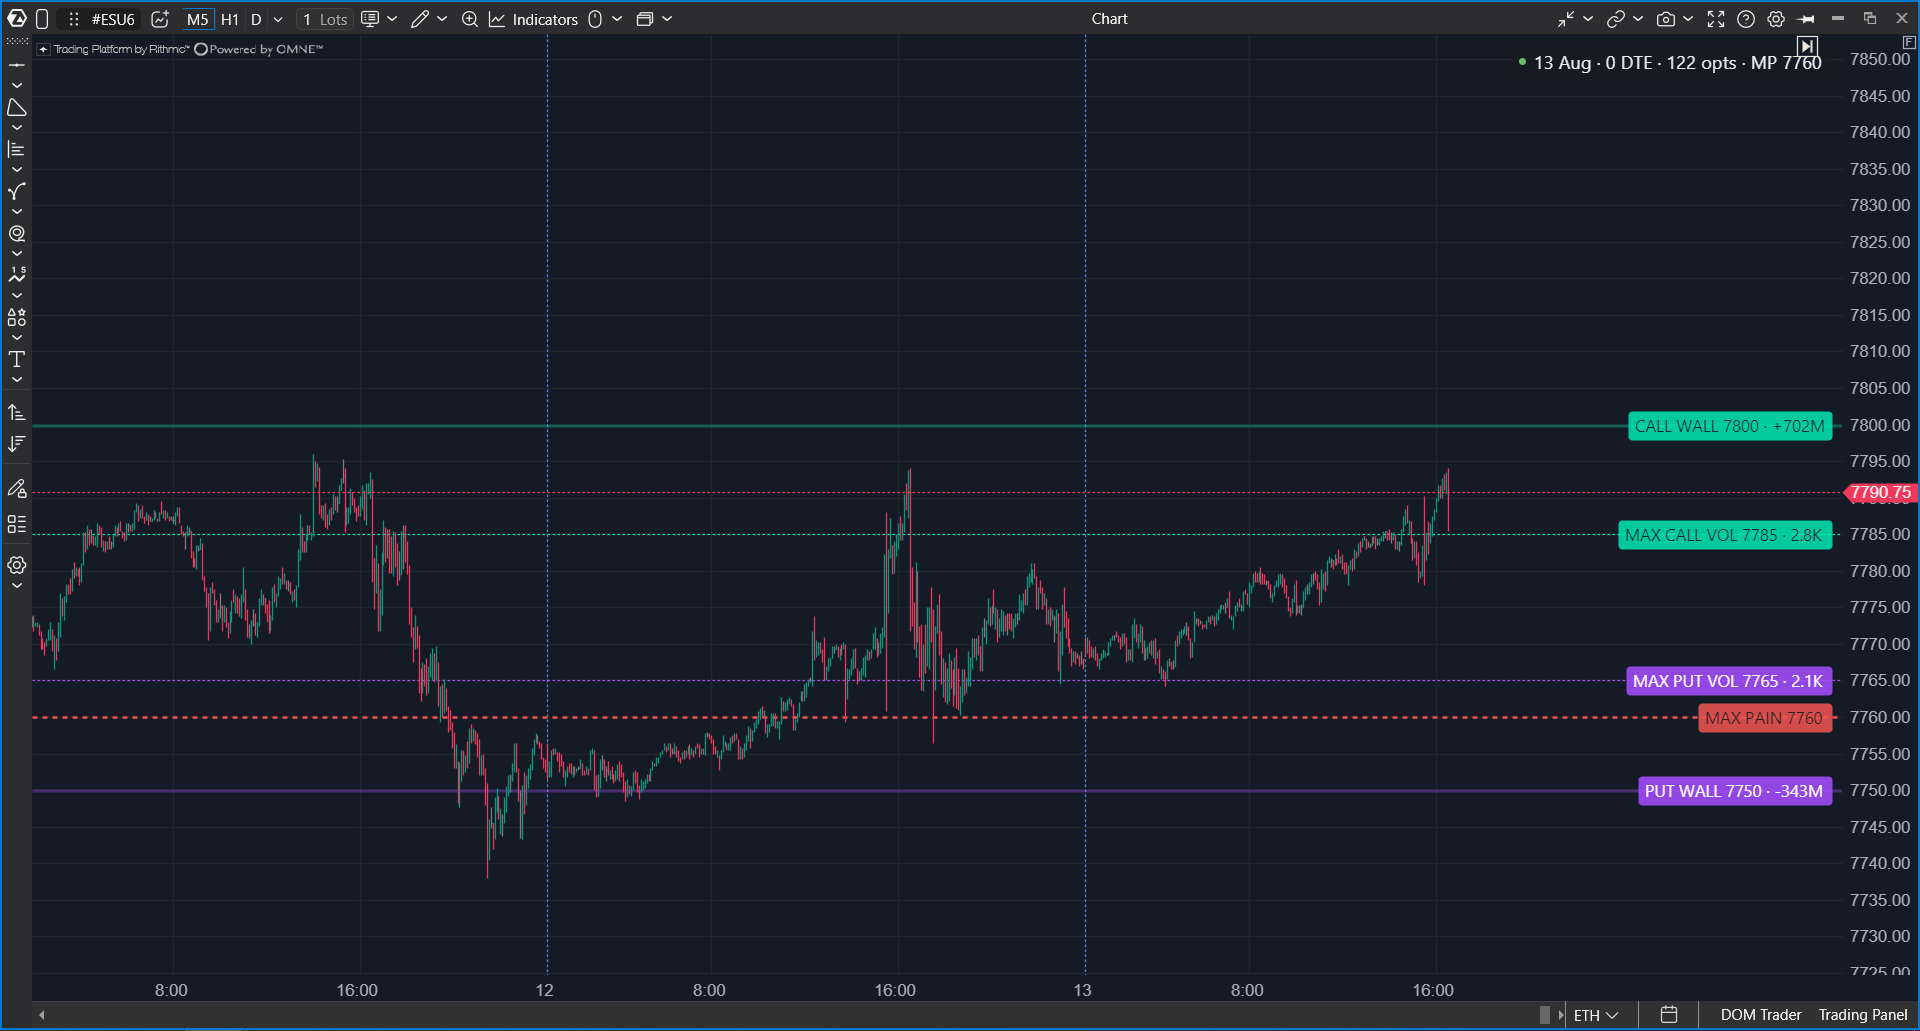
The indicator helps you see support and resistance candidates derived from options positioning. It is most useful when you want option-based levels without reading the full option chain manually.
Before you start
Make sure that your connected data provider supports options and provides options data for the selected underlying instrument. Data availability depends on the provider, account permissions, instrument, and market data subscription. Options data can be available through Interactive Brokers or Rithmic, depending on your setup.
How option analytics indicators work
Option analytics indicators subscribe to a range of option strikes around the current underlying price for the selected expiration series. ATAS receives live market data such as bid, ask, last price, open interest, and day volume.
Values such as implied volatility and Greeks are calculated in ATAS from the available option prices. The indicators then aggregate the data by strike, expiration, side, or time interval and display the result on the chart.
What Options Key Levels shows
- MAX PAIN — the expiration price at which the total intrinsic value paid out to option holders would be the lowest. The indicator evaluates every listed strike in the analyzed window as a candidate and selects the one with the smallest total payout, weighted by open interest.
Max Pain is calculated from open interest. If the chain provides no open interest, the level is not drawn at all.
- CALL WALL — the strike with the strongest positive gamma exposure inside the analyzed strike window, where call positioning dominates. It most often sits above the market and can act as a resistance candidate, but the indicator does not force it above the current price: when the heaviest call positioning is below the market, the wall is drawn there.
- PUT WALL — the strike with the strongest negative gamma exposure inside the analyzed strike window, where put positioning dominates. It most often sits below the market and can act as a support or acceleration candidate, and its position relative to the current price is not forced either.
- Volume levels optionally show strikes with the largest day volume.
Why it is useful
The indicator gives ready-to-use support and resistance candidates calculated from options data. These levels can be especially useful near expiration, when options positioning may have a stronger effect on price behavior.
How it works
Max Pain is calculated by checking candidate strikes and estimating where the total payout to option holders would be the lowest at expiration.
Walls are calculated from open interest weighted by gamma. For every strike in the analyzed window, call and put exposure are combined into a single net value, and the strikes holding the largest positive and the largest negative values become the call wall and the put wall. Distance from the current price does not affect the ranking. The same wall definition is used across the option analytics package, so Options Key Levels and Options GEX Profile should identify the same key strikes when they use the same settings.
Walls are always calculated from open interest, never from day volume. This is deliberate: it keeps Options Key Levels and Options GEX Profile naming the same strike as a wall when both indicators look at the same data.
Level labels automatically move apart when they overlap. Hovering over a level shows an explanatory tooltip.
Common Data settings
| Setting | Description |
|---|---|
| Expiration | Selects which expiration series is analyzed. Auto (nearest) uses the nearest available expiration and switches to the next series after expiration. |
| Strikes per side | Defines how many strikes above and below the current price are included in the calculation. |
Options Key Levels works with one expiration series because Max Pain from different expirations should not be merged.
Settings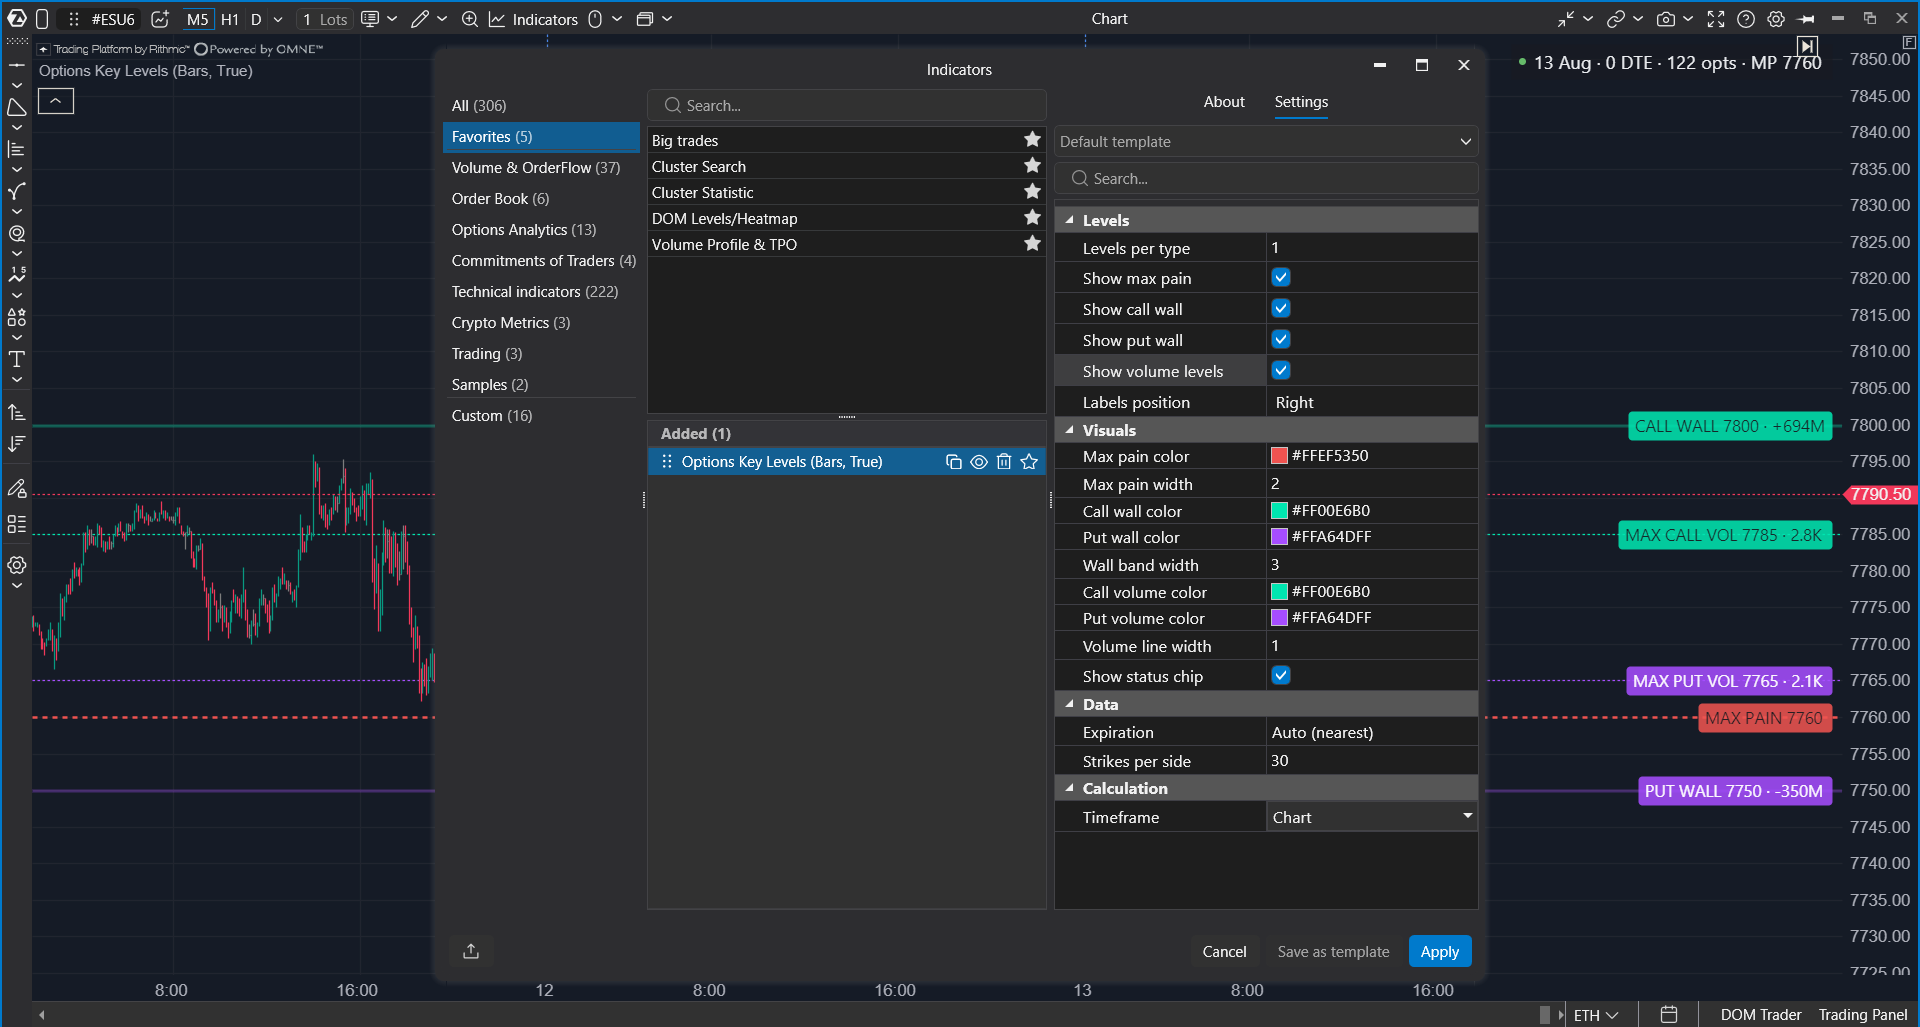
| Group | Setting | Description |
|---|---|---|
| Data | Expiration, Strikes per side | Defines the analyzed expiration and strike range. |
| Levels | Levels per type | Defines how many top levels of each type are shown. |
| Levels | Show max pain, Show call wall, Show put wall, Show volume levels | Shows or hides each level type. |
| Levels | Labels position | Controls where labels are placed: right, left, or center. |
| Visuals | Colors and line width | Controls the colors and thickness of Max Pain, wall, and volume lines. |
Status chip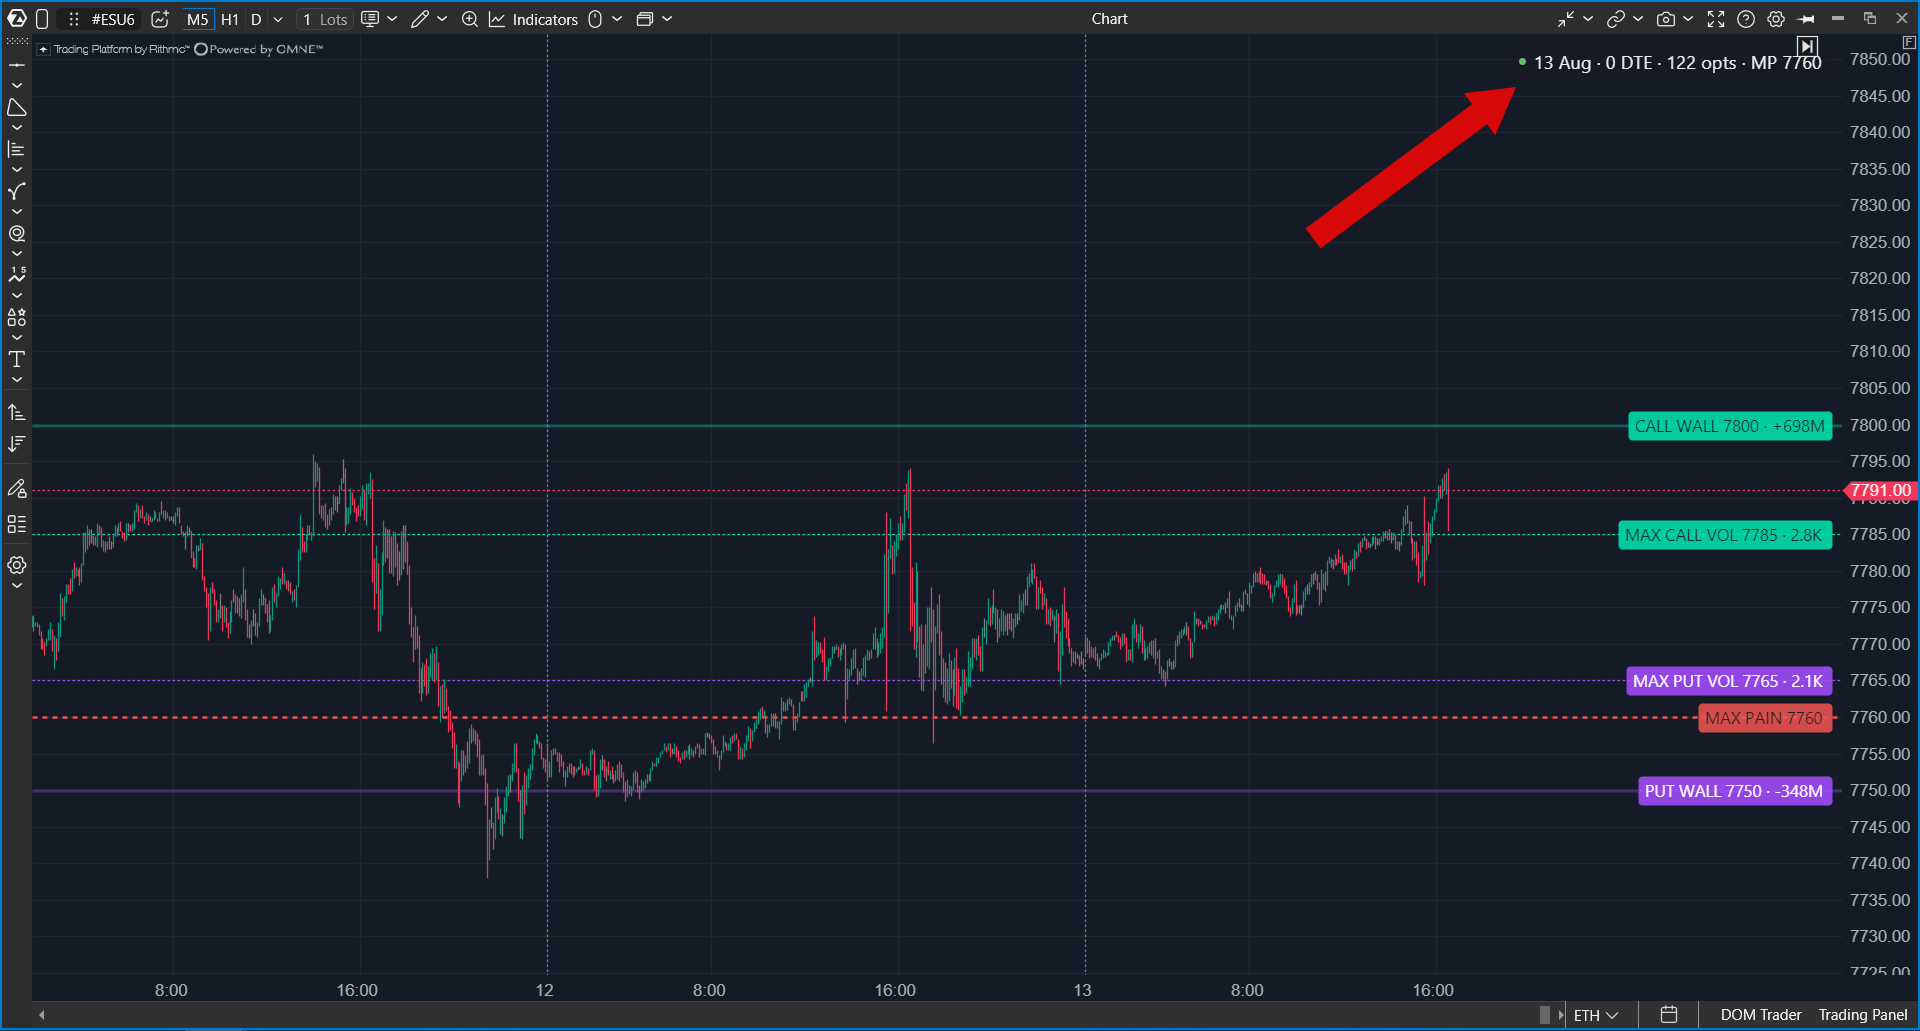
The status chip shows the selected expiration, days to expiration, and the number of subscribed option contracts. It can also show warm-up progress or connection warnings.
Practical recommendations
- Use MAX PAIN as an expiration-related reference level, not as a guaranteed target.
- Compare CALL WALL and PUT WALL with visible support and resistance areas on the chart.
- Near expiration, watch whether price reacts around the displayed walls or crosses them with strong volume.
- The value in a wall label shows the strength of the level. Larger values usually indicate more important levels.
- The calculation uses the subscribed strike range, so strikes outside this range are not included.
Frequently asked questions
Why does the indicator need time to warm up?
The indicator has to subscribe to multiple option contracts and collect enough quotes for the selected strike and expiration range.
Why do levels differ from other services?
Different tools may use different data sources, expiration filters, strike ranges, open interest update timing, implied volatility methods, or wall definitions.
What should I check if the indicator shows no data?
Check that your connection provides options data for the selected underlying instrument, that the required market data subscription is active, and that the selected expiration range contains available option contracts.
Related articles
- Indicator settings window
- Indicators Navigation on Chart
Was this article helpful?
That’s Great!
Thank you for your feedback
Sorry! We couldn't be helpful
Thank you for your feedback
Feedback sent
We appreciate your effort and will try to fix the article