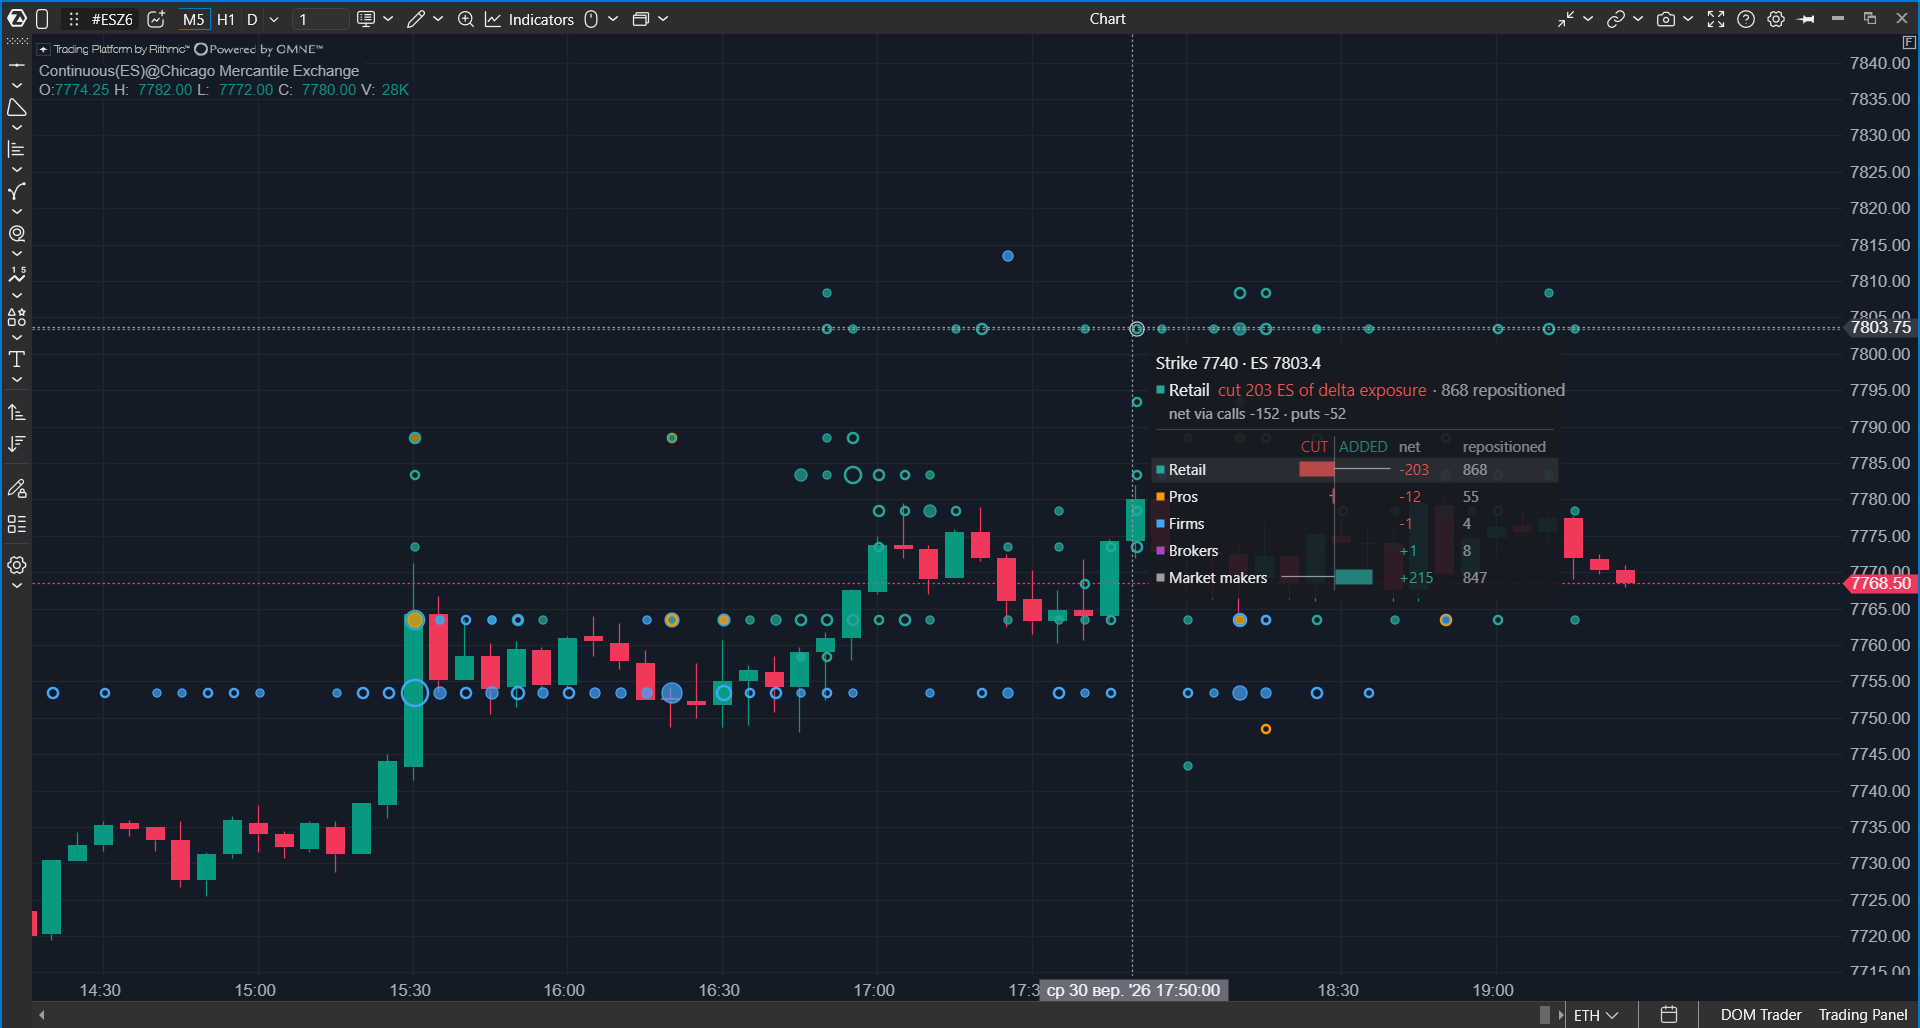
Options X-Ray: Big Trades marks the largest position changes in S&P 500 index options on an ES, MES, SPY, or US 500 chart. Each mark shows when the change happened, which strike it happened at, who made the change, and whether that group's position increased or decreased.
Options X-Ray: Big Trades shows large position changes in the options market and separates them by participant group: retail traders, professional clients, firms, brokers, and market makers.
 Why Use It
The options tape can show that a large option trade happened, but it does not show who was behind it. OptionsDepth analytics, derived from CBOE market data, add this context: which participant group made the trade and the position direction. Big Trades brings this information to the chart.
Instead of only seeing that a large trade occurred at a strike, you can see that a specific participant group increased or reduced exposure at that strike by a certain ES-equivalent amount.
Big Trades shows how much the position changed. It does not show the final total position. A reduction can mean closing an existing position or building exposure in the opposite direction. To see the position itself at a strike, use Options X-Ray: Strike Profile (GEX/DEX/VEX/CEX).
Questions It Helps Answer
- Who is behind large activity at a level: retail traders, professionals, firms, brokers, or market makers?
- When price reaches a level, is someone building exposure for a breakout, or are sellers defending the level?
- Did a participant group move exposure decisively in one direction, or did it reposition back and forth?
- Did large exposure appear near the current price, a round level, or before a major event?
Use these answers to build a market hypothesis. Confirm entries with your usual tools, such as tape, clusters, delta, and price reaction.
Big Trades is not a trading signal. A bubble shows that a large position change happened, but it does not explain the participant's reason: hedging, opening a directional trade, or building a multi-leg options position.
What You Should Know Before You Start
| Chart | Use an ES, MES, SPY, or US 500 chart. ES and MES work with any specific contract, for example ESZ5. The data is OptionsDepth analytics derived from CBOE market data for S&P 500 index (SPX) options, and it is mapped to the chart automatically. |
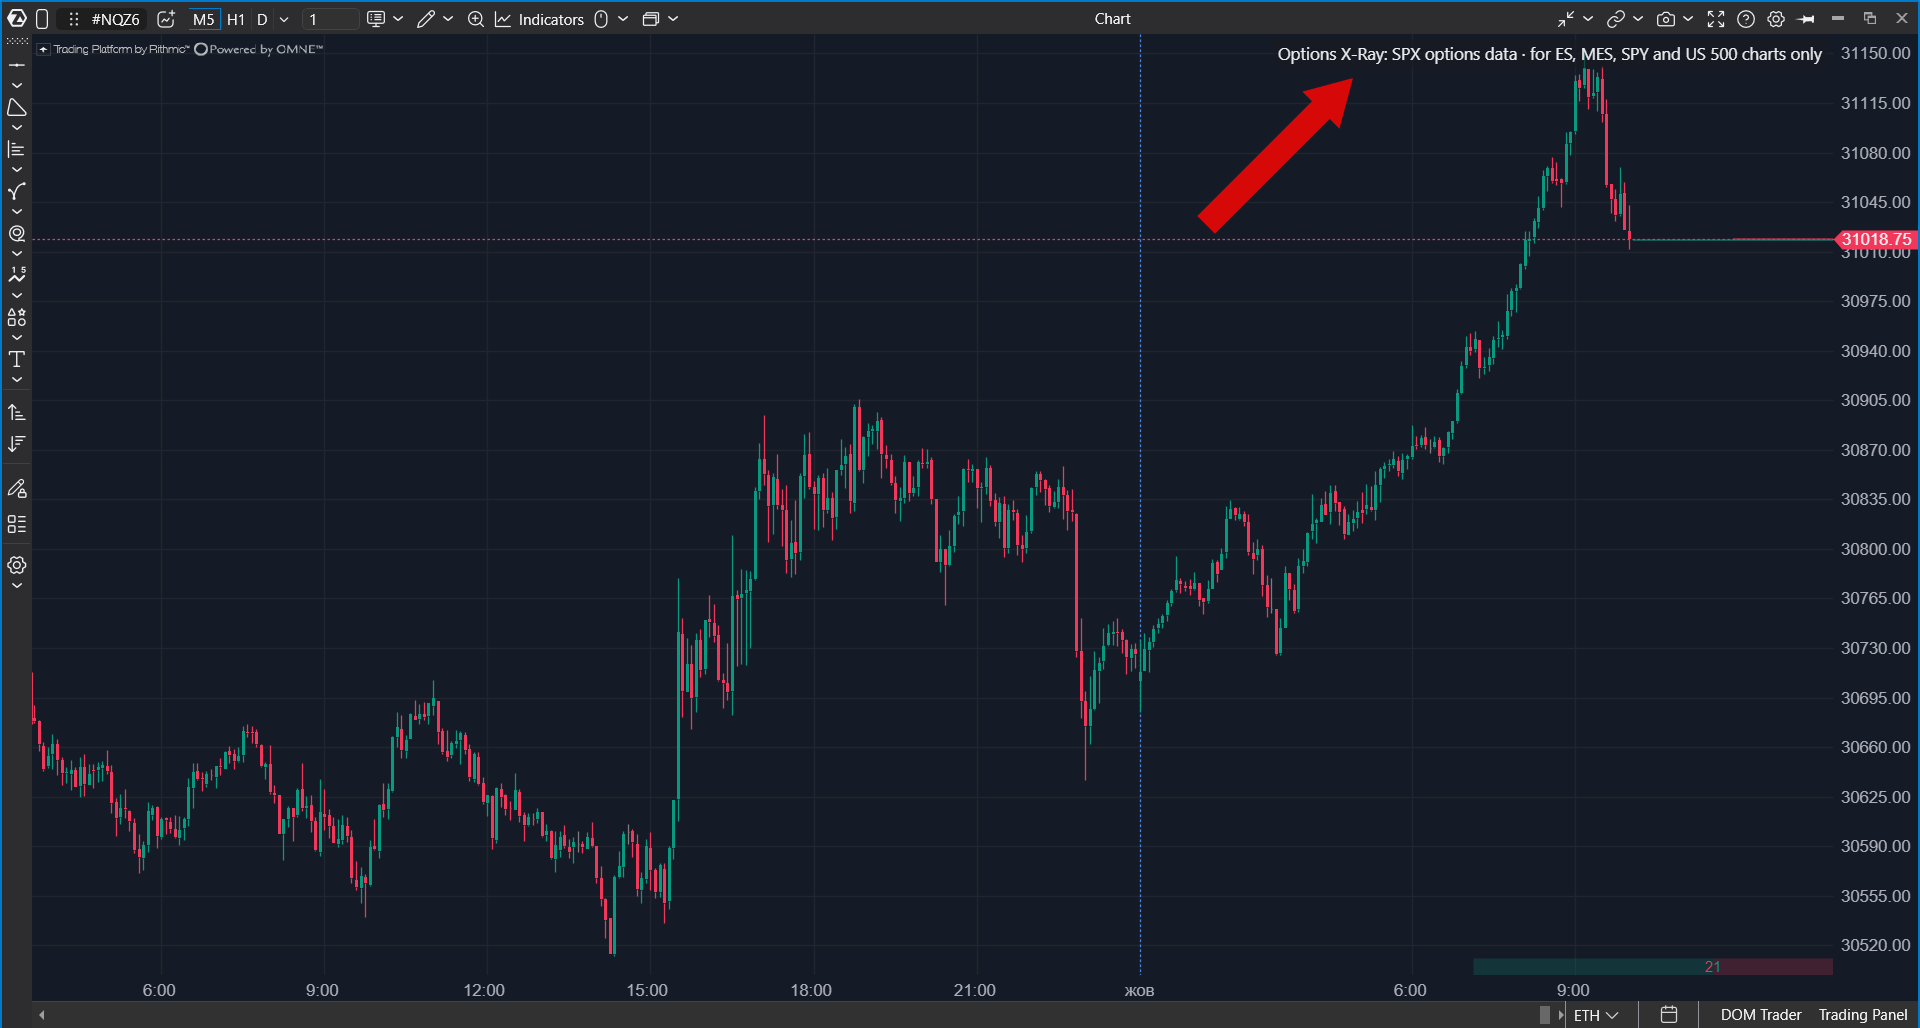
| Other markets | On any other instrument (NQ, oil, gold, individual stocks, crypto) the indicator draws nothing and shows an explanatory chip instead: Options X-Ray: SPX options data · for ES, MES, SPY and US 500 charts only. For CME futures options, use the separate Options Chain tools. |
| Update frequency | The data updates once per minute. A chart bar combines all minute-level changes that fall inside that bar. |
| Units | Values are shown in ES contracts, not in the number of option contracts. For example, Pros cut 150 ES means professional clients changed exposure by an amount equivalent to selling 150 ES futures contracts. They did not necessarily sell ES futures. |
| Access | Options X-Ray indicators are part of a separate package. If the indicator is not in the list, check whether the package is enabled in your account. |
| Data | Built on minute-level SPX options positioning analytics derived from CBOE market data. Data & analytics by OptionsDepth. |
Option contracts far from the current price and option contracts near the current price carry very different risk. Comparing them by contract count alone is not useful. Converting exposure into ES contracts makes strikes comparable.
How to Read a Bubble
Each bubble represents one large position change by one participant group at one strike during one chart bar.
| Element | Meaning |
| Horizontal position | The bar where the change happened. |
| Vertical position | The option strike mapped to the chart price scale. |
| Size | How much exposure was repositioned during the bar in both directions. A larger bubble means more movement at that strike. |
| Color | The participant group: Retail, Pros, Firms, Brokers, or Market makers. Colors can be changed in settings. |
| Fill | A filled bubble means the participant added exposure by the end of the bar. An outlined bubble means the participant reduced exposure by the end of the bar. |
Size and fill answer different questions. Size shows how much exposure moved. Fill shows the net result. A large outlined bubble can mean that the participant repositioned a lot, while the final net change was small.
The indicator does not show every change. It shows only the largest changes, by default the top 2% of the trading session. The threshold is calculated for the full session, so bubbles do not appear or disappear when you zoom the chart.
Net and Repositioned
This is the main concept behind the indicator. Inside one bar, a participant can add and reduce exposure several times. These changes can be summarized in two ways.
| Value | Meaning | Similar to |
| net | The final result of the bar: how much the position increased or decreased. It can be positive or negative. | Delta of a bar. |
| repositioned | The total amount moved during the bar, counting both directions. It is always at least as large as the absolute net value. Bubble size is based on this value. | Volume of a bar. |
If net is close to repositioned, the group moved decisively in one direction. For example, Pros cut 150 ES of delta exposure · 150 repositioned means professionals reduced exposure by 150 and did not meaningfully move it back.
If net is much smaller than repositioned, the group actively moved exposure but ended with little final change. For example, Pros cut 9 ES of delta exposure · 184 repositioned means professionals moved 184 ES-equivalent exposure, but the final position changed only slightly.
Repositioned shows activity that left a trace in minute-level data. If exposure was opened and closed within the same minute, the indicator may not see it. Real activity can be higher than shown, but not lower.
Tooltip Card
Hover over a bubble to open a card with everything that happened at that strike during that bar.
| Card row | What it shows |
| Strike and chart level | The option strike and the level where it is drawn on the current chart. The label names the chart instrument, for example ES on an ES chart or US500 on a US 500 chart. For previous days, the card can show where the strike is drawn today and where it was at that time. |
| Main bubble summary | The selected bubble: who acted, whether exposure was added or cut, the net value, and the repositioned value. |
| net via calls / puts | How the net value was formed through call options and put options. |
| Participant table | The net and repositioned values for each group at this strike during this bar. Bars to the left show cut exposure. Bars to the right show added exposure. |
The Market makers row is always shown in the card, even if market-maker bubbles are hidden on the chart. Market makers are usually the other side of trades made by the other groups, so their net value is close to the opposite of the combined value of the other participants. To understand who is taking risk, focus on the non-market-maker groups.
Participant Groups
| Group | Who they are |
| Retail | Private traders. |
| Pros | Professional clients: active traders and smaller funds whose activity is too high to be classified as retail. They are often on the opposite side of retail traders. |
| Firms | Funds, proprietary trading firms, and institutional clients. This group often includes large blocks, portfolio hedges, and event-related positions. |
| Brokers | Broker-dealers that are not acting as market makers. |
| Market makers | The other side of trades made by the other groups. Their bubbles are hidden by default because they often mirror the other participants. |
How to Add the Indicator
- Open an ES, MES, SPY, or US 500 chart.
- Click Indicators on the top panel.
- Select the Options Analytics group or type Options in search.
- Select Options X-Ray: Big Trades.
- Click Add to chart.
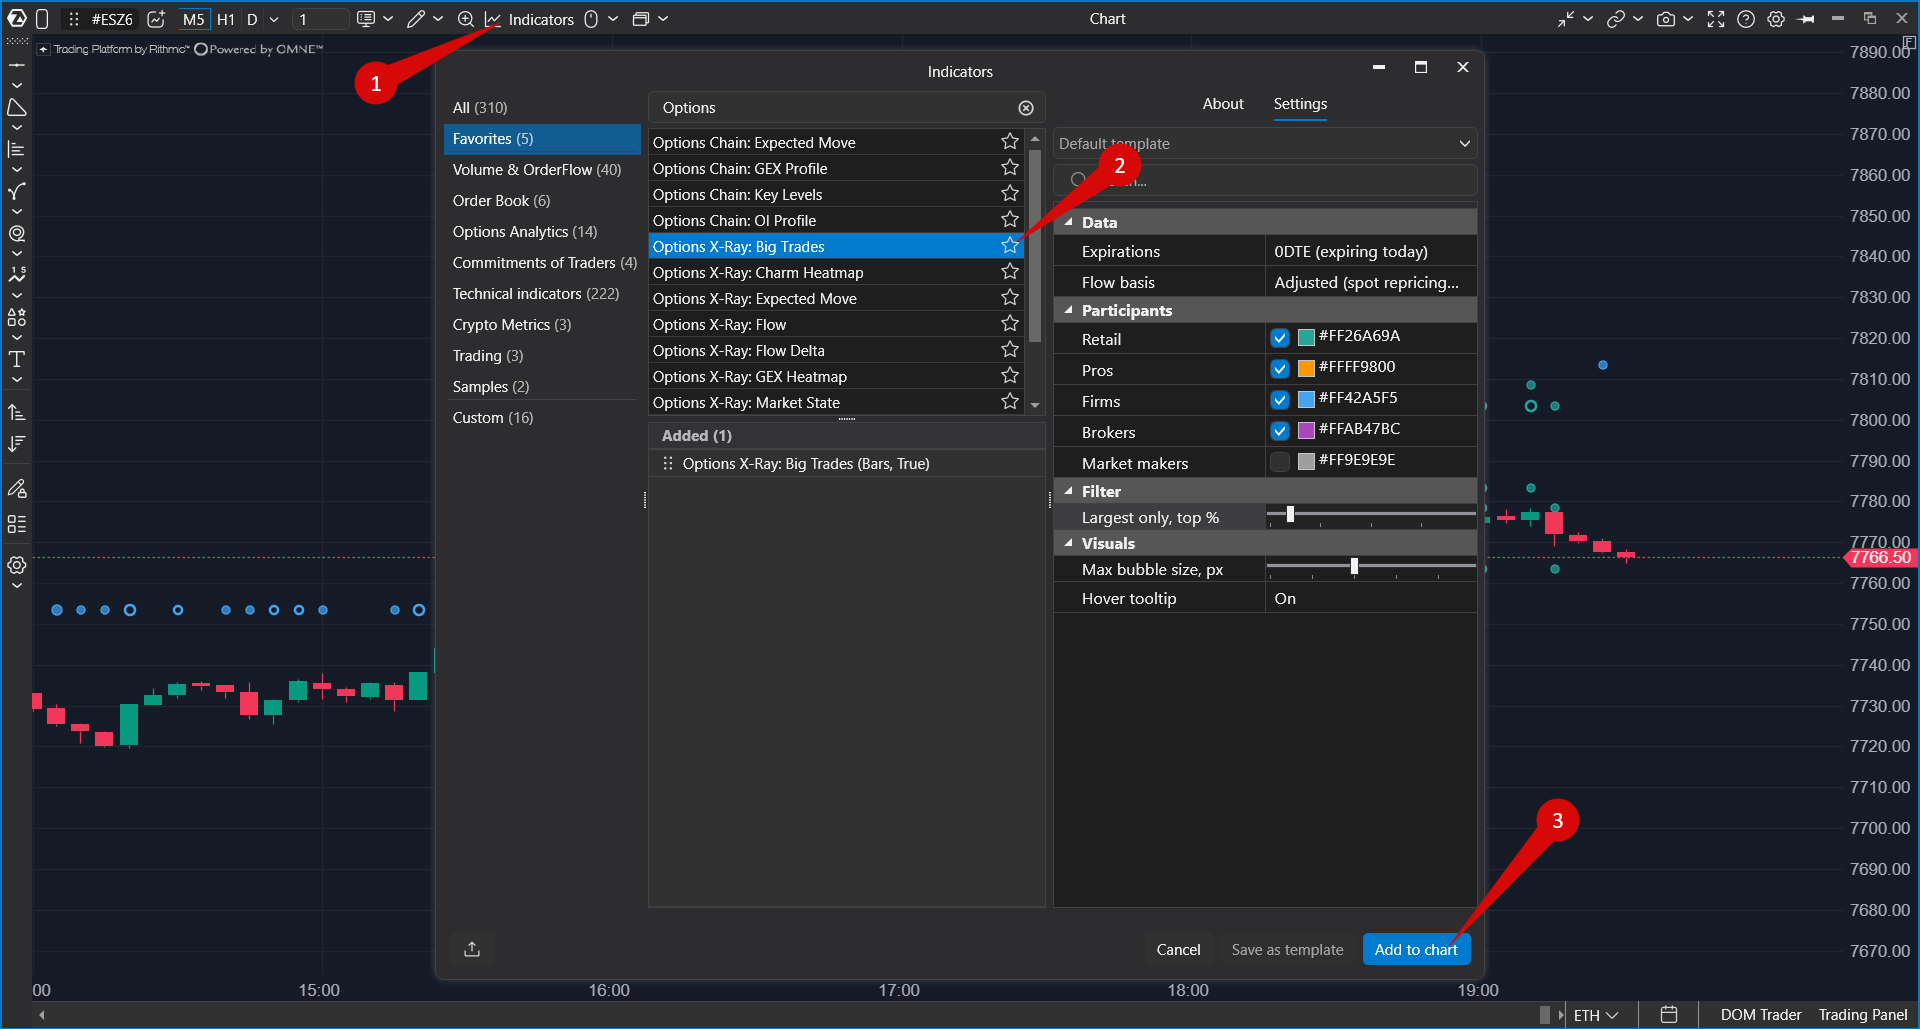 To change settings later, open Indicators again, select the indicator in the Added section, and click Apply.
Settings
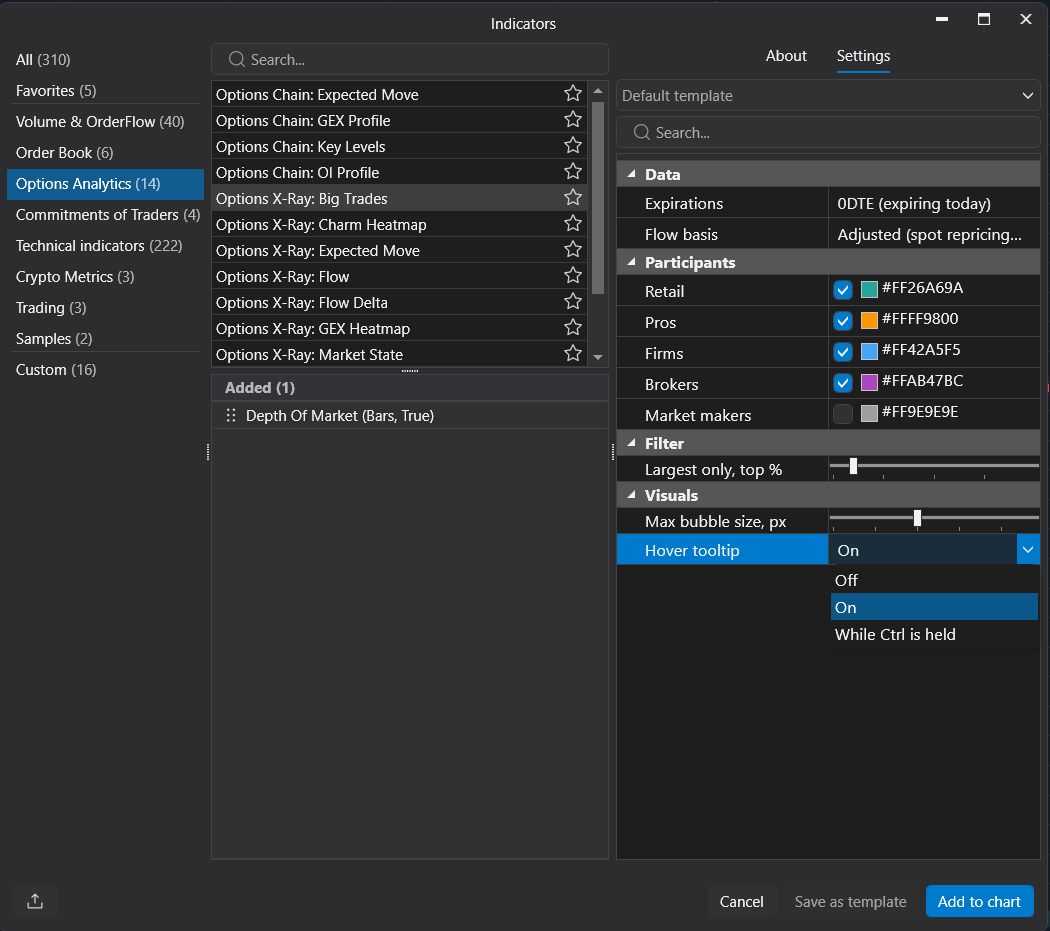
| Setting | What it does |
| Expirations | Selects which option expirations are included. The default is 0DTE, options expiring today. You can also select the nearest next expirations, the full week, or the monthly series. |
| Flow basis | Defines how position changes are calculated. The default is Adjusted. If you compare several charts or several Options X-Ray indicators, use the same value everywhere. |
| Retail, Pros, Firms, Brokers | Shows or hides bubbles for each group. The color on the right controls the group color on the chart. |
| Market makers | Shows market-maker bubbles. They are hidden by default because they often duplicate the opposite side of other participants. |
| Largest only, top % | Defines what share of the largest session changes is shown, from 0.01% to 20%. The default is 2%. Lower values keep the chart cleaner. Higher values show more medium-sized changes. |
| Max bubble size, px | Changes the largest visual bubble size in pixels. It affects only appearance, not calculation or filtering. |
| Hover tooltip | Controls the hover card: Off, On (default), or While Ctrl is held. The Ctrl mode keeps the chart clean and shows the card only on demand. |
On monthly expiration day, the third Friday of the month, two series can expire: the monthly series in the morning and the weekly series in the evening. Before the monthly series is settled, 0DTE can show the monthly series. After settlement, it switches to the weekly series. The picture can change noticeably, and this is expected.
How to Work With the Indicator
Big Trades works best together with two other flow indicators. Together, they answer three questions from general to specific.
| Indicator | Question |
| Options X-Ray: Flow | How much exposure was repositioned during the bar, and by whom? |
| Options X-Ray: Flow Delta | In which direction did positions shift during the bar? |
| Options X-Ray: Big Trades | Who acted, at which strike, and by how much? |
- Find the largest bubbles near the current price.
- Check the color to see who acted and the fill to see whether exposure was added or cut.
- Hover over the bubble and compare net with repositioned.
- Check whether other groups also have bubbles at the same strike.
- Watch how price reacted at that level afterward.
Troubleshooting
| What happens | What to do |
| The indicator is not in the list | Check whether the Options X-Ray package is enabled in your account. |
| There are no bubbles, and the chart shows the chip "Options X-Ray: SPX options data · for ES, MES, SPY and US 500 charts only" | The chart instrument is not supported. Open an ES, MES, SPY, or US 500 chart. |
| There are no bubbles on a supported chart | Make sure at least one participant group is enabled and Largest only, top % is not set too low. During weekends and holidays there is no new data, but previous sessions should still be shown. |
| There are too many bubbles | Reduce Largest only, top %. |
| Bubbles cover the candles | Reduce Max bubble size, px. |
| A large bubble has almost zero net value in the card | This is expected. Bubble size is based on repositioned exposure, not net exposure. |
| Bubble levels look inaccurate, and the indicator status mentions calibration | The chart does not have enough history to map index levels to the chart accurately. Load more days on the chart. |
| The 0DTE picture changed sharply on Friday morning | If it is the third Friday of the month, the monthly series may have expired and the indicator switched to the weekly series. This is expected. |
| Values differ from another chart | Compare Expirations, Flow basis, and enabled participant groups. They should match. |
| Values differ from other options analytics services | Different services use different data sources, update times, and calculation methods. Differences are normal. |
Was this article helpful?
That’s Great!
Thank you for your feedback
Sorry! We couldn't be helpful
Thank you for your feedback
Feedback sent
We appreciate your effort and will try to fix the article