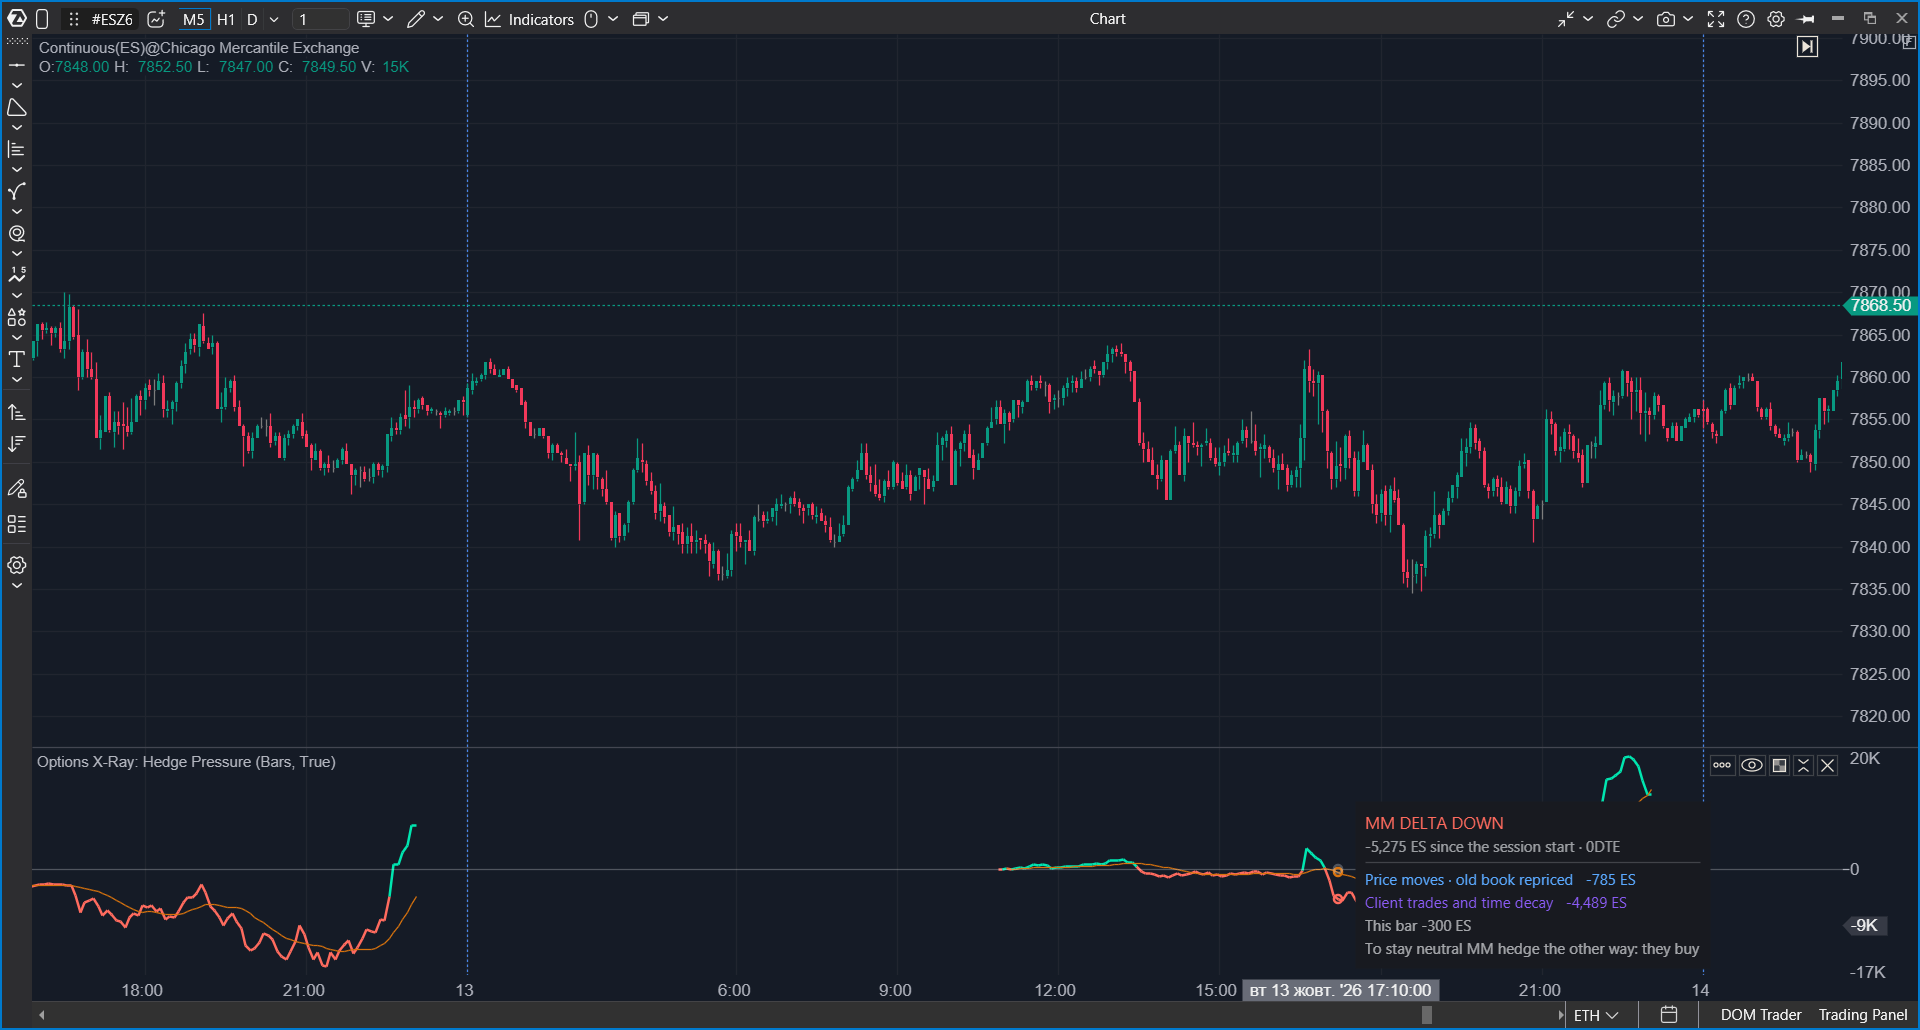
Options X-Ray: Hedge Pressure draws a line in a separate panel below an ES, MES, SPY, or US 500 chart. The line shows how much the delta of the market-maker position in SPX options has changed since the start of the current session, and in which direction market makers have to hedge it with futures. Every session starts from zero.
Why Use It
Market makers do not want to hold directional risk. When the delta of their option position changes, they bring it back to neutral with futures. A change in delta is therefore a hedge that market makers have already made or still have to make:
| Line | What happened | Hedge |
| Above zero and rising | Market makers became longer in delta. | To stay neutral, they sell futures: selling pressure. |
| Below zero and falling | Market makers became shorter in delta. | To stay neutral, they buy futures: buying pressure. |
The indicator helps answer questions such as:
- Is market-maker hedging working against today's move or with it?
- How much hedging has built up since the session started?
- Has the pressure inside the day just changed direction?
- Is the change in the market-maker position driven by price or by new client trades?
The line is a consequence, not a forecast. It shows what has already happened to the market-maker position. It does not promise that the hedge is executed in this exact minute. Confirm entries with tape, clusters, and delta.
What You Should Know Before You Start
| Chart | Use an ES, MES, SPY, or US 500 chart. ES and MES work with any specific contract, for example ESZ5. The data is OptionsDepth analytics derived from CBOE market data for S&P 500 index (SPX) options. |
| Other markets | On any other instrument (NQ, oil, gold, individual stocks, crypto) the indicator draws nothing and shows an explanatory message instead. |
| Update frequency | The data updates once per minute. The values come from options positioning, not from chart candles, so the line is the same on any timeframe and does not depend on how much history is loaded. |
| Hours | The line is drawn while SPX options data is available: from about 04:00 to 16:00 New York time. In the evening and at night there are no values, and the line resumes from zero with the next session. |
| Units | ES contracts by default. One SPX option delta equals two ES contracts. A value of +12,400 ES means that the delta of the market-maker position grew by the equivalent of 12,400 futures. You can switch to US dollars of notional value, for example +$2.45B. |
| Access | Options X-Ray indicators are part of a separate package. If the indicator is not in the list, check whether the package is enabled in your account. |
| Data | Built on minute-level SPX options positioning analytics derived from CBOE market data. Data & analytics by OptionsDepth. |
How to Read the Line
Read the line the same way as cumulative delta: the exact numbers matter less than how the line behaves next to price.
| What you see | What it means |
| The line moves with price | On a rally, market makers become longer and sell. On a drop, they become shorter and buy. Hedging works against the move: the day tends to be slow, and moves fade. |
| The line moves against price | On a rally, market makers become shorter and have to buy more. Hedging works with the move and can speed it up. |
| The line crosses its moving average | The pressure inside the day has changed direction. |
Two Parts of the Line
The delta of the market-maker position changes for two reasons. Enable Show the two parts of the line to see them separately. Together, the two parts add up to the main line.
| Part | What it shows |
| Price movement | The existing position was revalued: price moved, so the delta of the options changed, even though nobody bought or sold anything. |
| Client trades and time | Everything else: new client positions and the effect of approaching expiration on delta. |
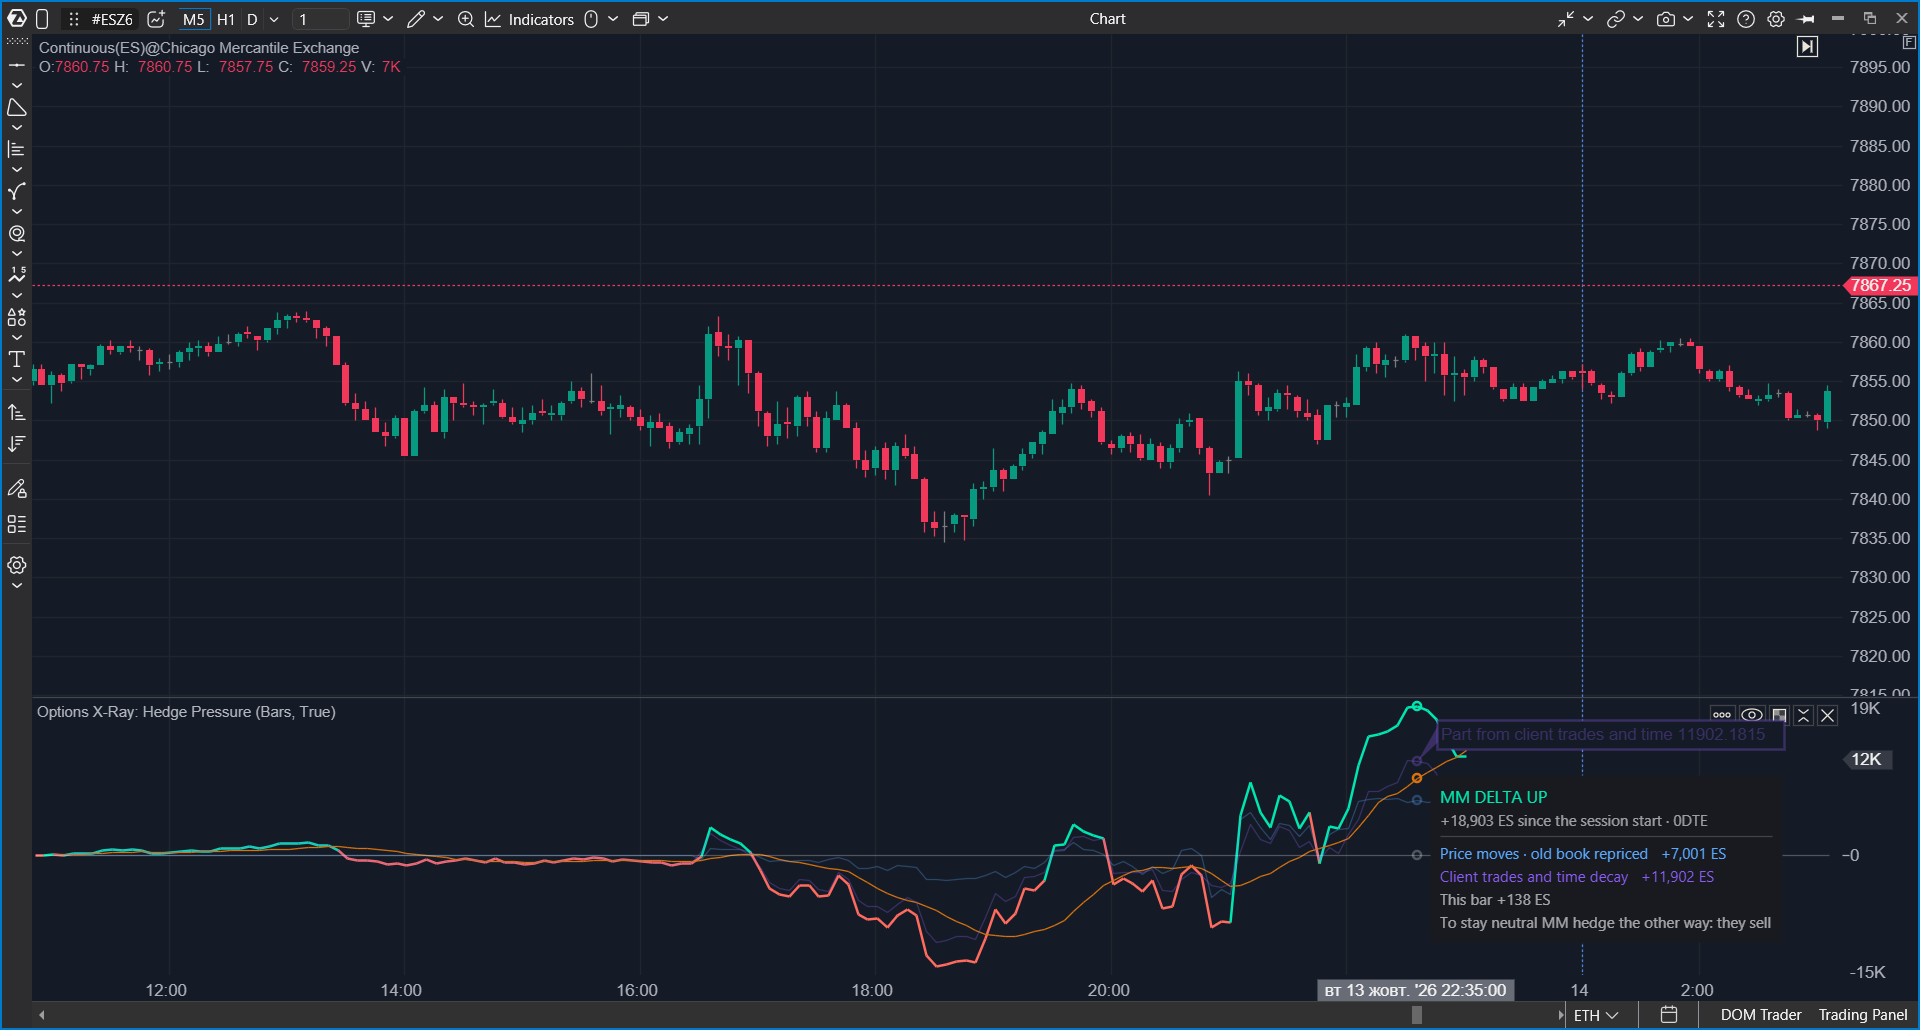
Example from the session of 9 October 2026. Price rose all day, and the line rose with it to about +20,000 ES contracts. About two thirds of this came from the price part and one third from trades. Market makers became longer and sold futures: hedging worked against the rally. Toward the close, the parts moved apart: trades pushed the delta below zero, while the price part kept it above. The main line, which is their sum, lost three quarters of its gain in forty minutes. The line ends at 16:00 New York time, when options close.
Tooltip Card and Status Line
Hover over the panel to open a card for the bar under the cursor.
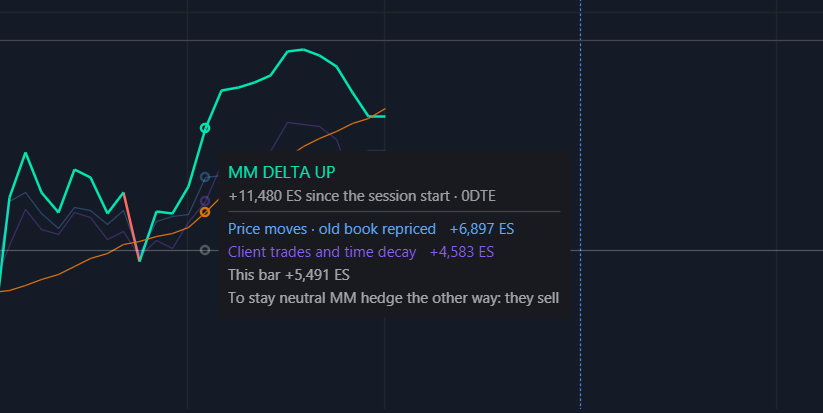
| Card part | What it shows |
| Title | MM DELTA UP, MM DELTA DOWN, or MM DELTA FLAT. |
| Change since session start | How much the delta of the market-maker position has changed since the session started, and which expirations are included. |
| Two parts | The price part and the trades-and-time part, if they are available for this session. |
| Change in this bar | How much the line moved during this bar. |
| Hedge row | What market makers do to stay neutral, for example To stay neutral MM hedge the other way: they sell. |
By default, the status line at the top of the panel appears only when there is something to report: data is loading, there is no data, the data is delayed, or the two parts are not available for this session. If you enable Show status, the line is always shown with the current value and both parts.
How to Add the Indicator
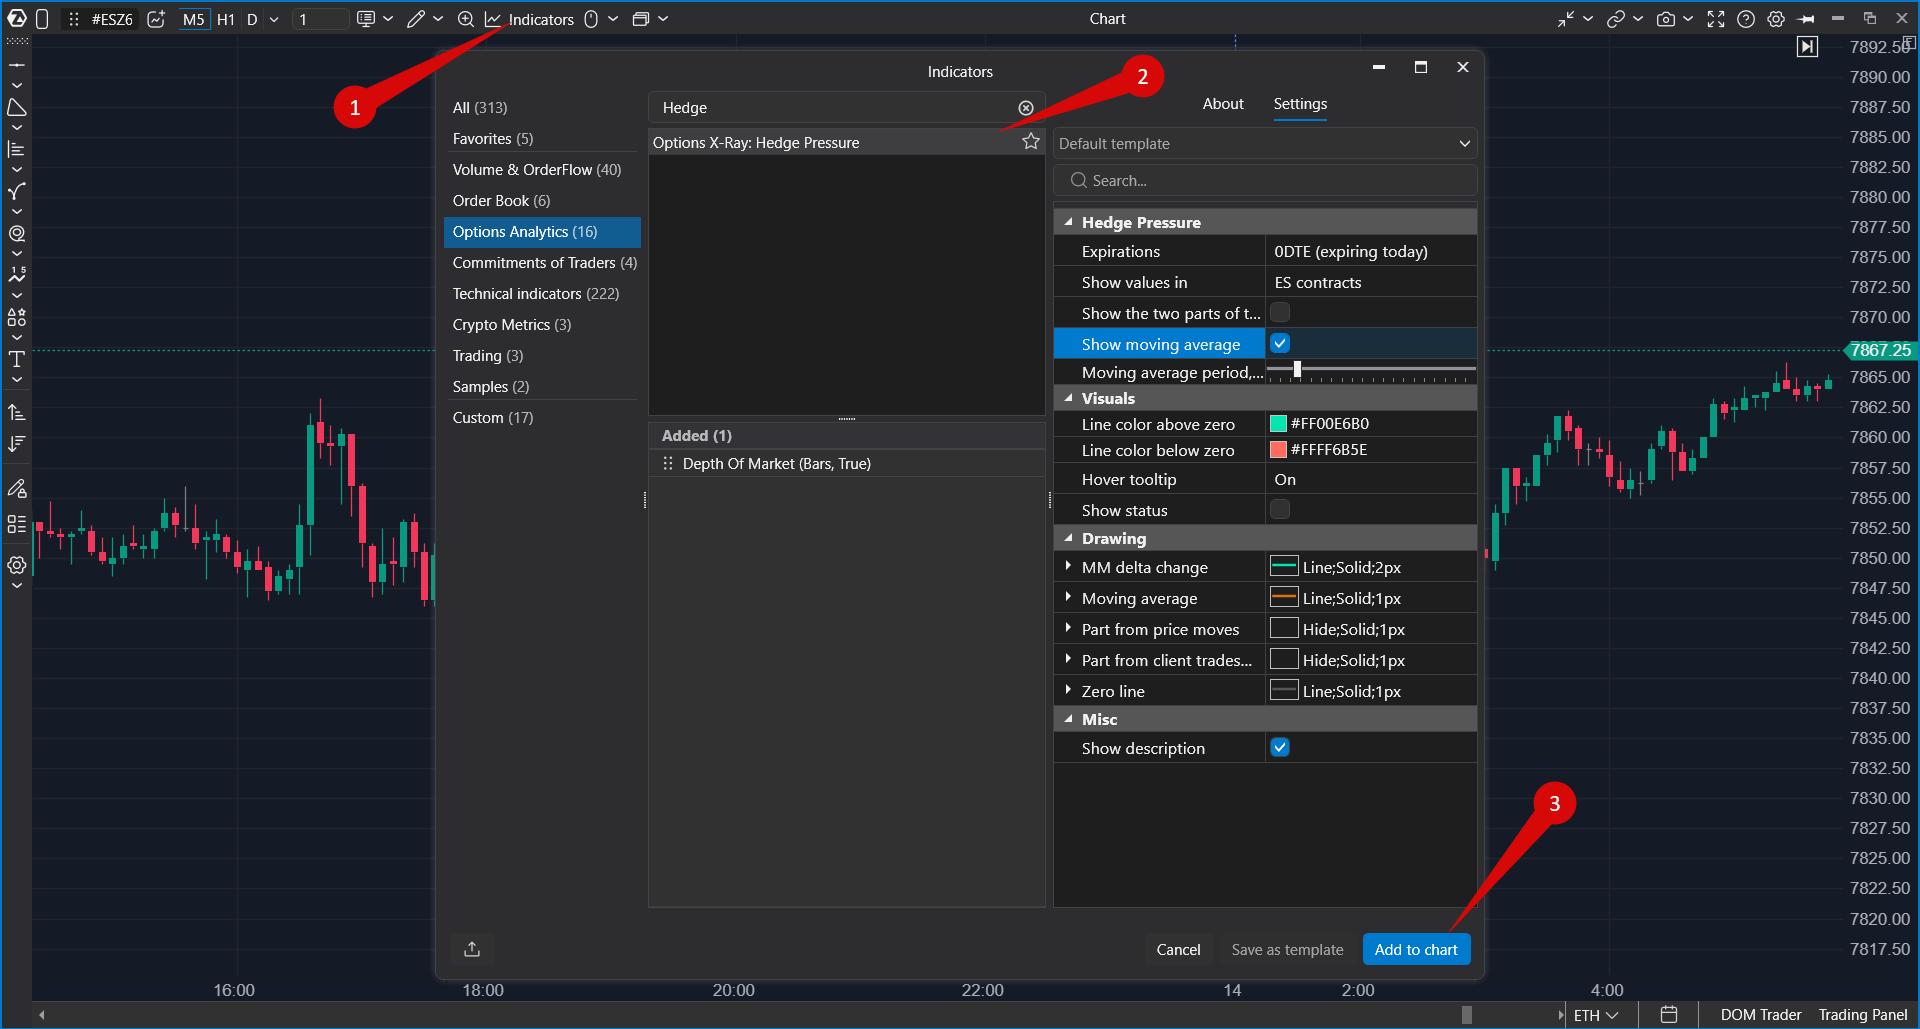
- Open an ES, MES, SPY, or US 500 chart.
- Click Indicators on the top panel.
- Select the Options Analytics group or type Options in search.
- Select Options X-Ray: Hedge Pressure.
- Click Add to chart.
The indicator opens in a separate panel below the chart. To change settings later, open Indicators again, select the indicator in the Added section, and click Apply.
Settings
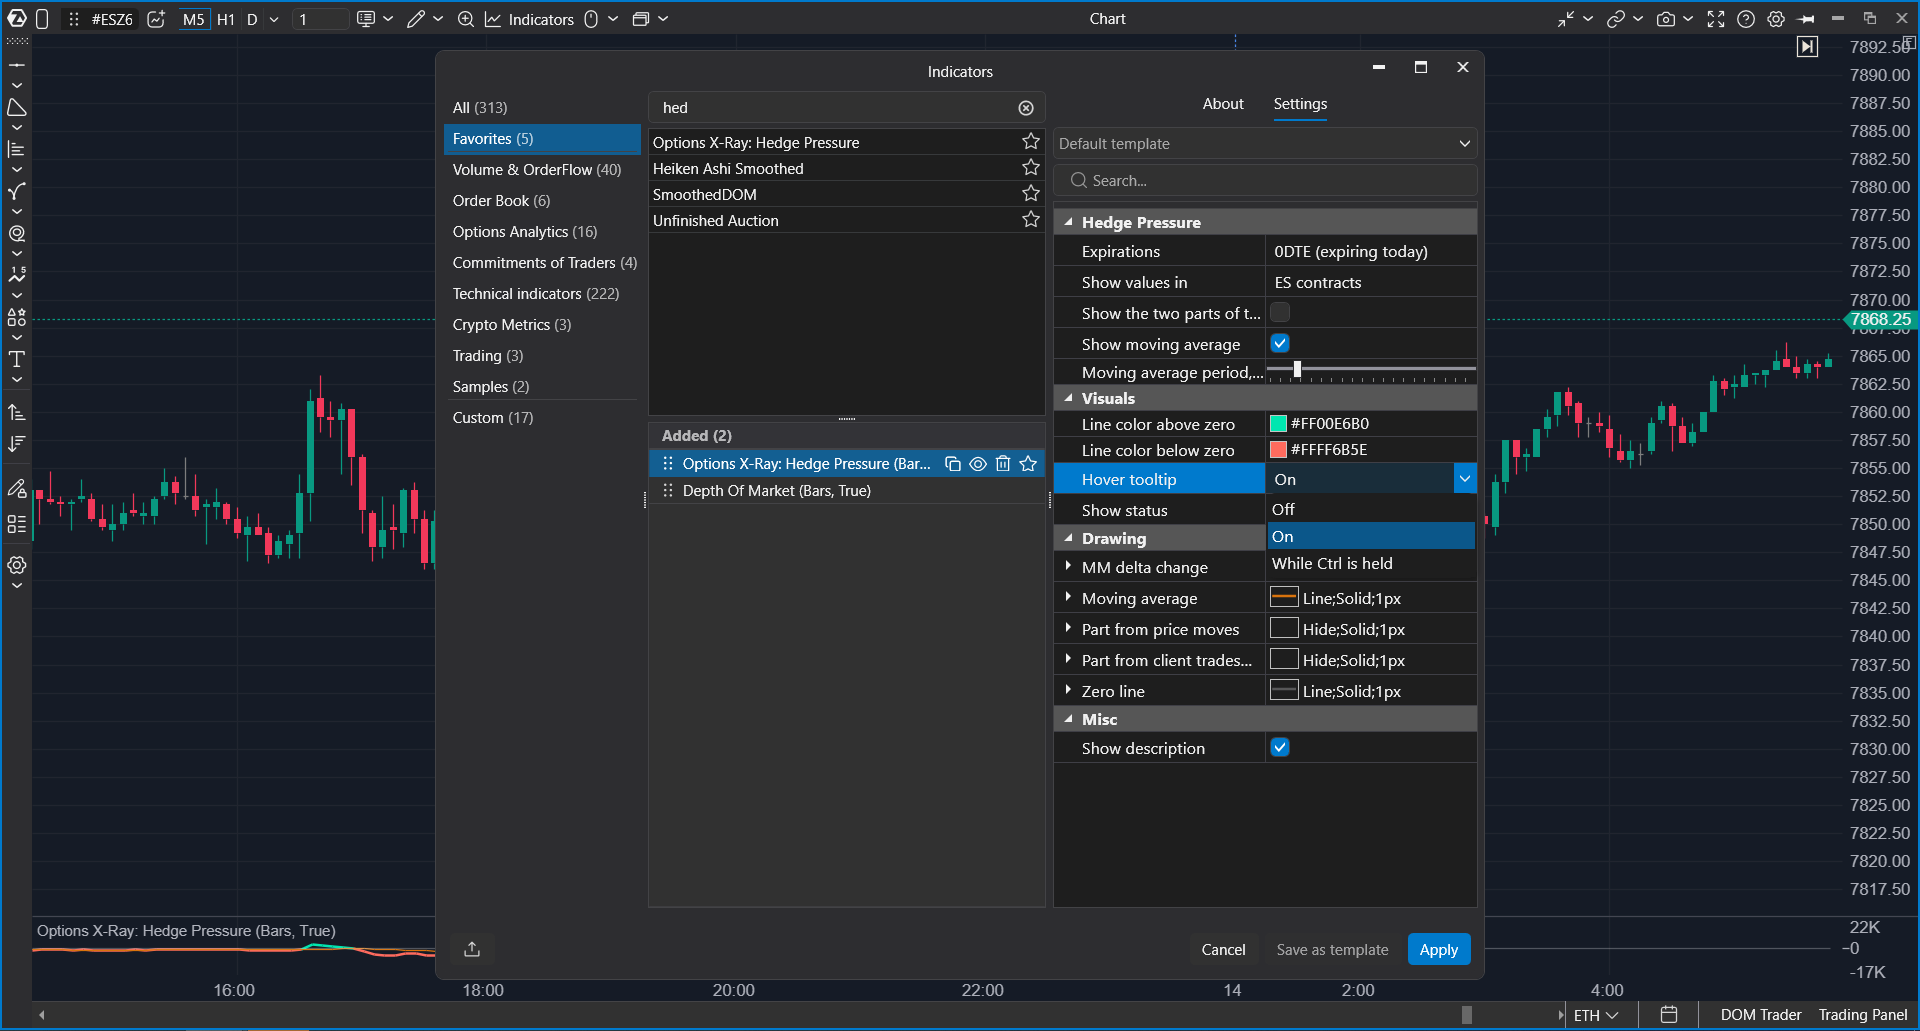
| Setting | What it does |
| Expirations | Selects which expirations are used. The default is 0DTE: options that expire today carry most of the intraday hedging. |
| Show values in | ES contracts (default), as in the rest of the package, or US dollars of notional value. |
| Show the two parts of the line | Draws the price part and the trades-and-time part. Disabled by default. |
| Show moving average | Shows the moving average of the main line. Enabled by default. |
| Moving average period, bars | From 2 to 100 bars. The default is 15. The average starts again every session. |
| Line color above zero / below zero | The color of the main line depending on its sign. The default is green above zero and red below. |
| Hover tooltip | Controls the hover card: Off, On (default), or While Ctrl is held. The Ctrl mode keeps the chart clean and shows the card only on demand. |
| Show status | Always shows the status line with the current value. Disabled by default. Problems are reported regardless of this setting. |
The indicator lines are regular ATAS series. You can change the thickness, style, and color of the moving average, the two parts, and the zero line in the standard series settings.
How to Work With the Indicator
- At the start of the session, watch which way the line moves relative to price.
- If the line moves with price, expect a slower day: hedging works against moves.
- If the line moves against price, expect moves to accelerate: hedging works with them.
- Watch where the line crosses its moving average: the pressure inside the day may be turning.
- Enable the two parts if you want to know whether the change comes from price or from new trades.
- Confirm entries with tape, clusters, and delta.
To see where market-maker hedging is strongest by price level, add Options X-Ray: Key Levels or Options X-Ray: GEX Heatmap.
Troubleshooting
| What happens | What to do |
| The indicator is not in the list | Check whether the Options X-Ray package is enabled in your account. |
| The panel shows an explanation instead of the line | The chart instrument is not supported. Open an ES, MES, SPY, or US 500 chart. |
| The line ends earlier than futures trading | This is expected. Options close at 16:00 New York time. After that, the market-maker position does not change, and the line continues from zero with the next session. |
| There is no line in the evening or at night | This is expected. SPX options data is available from about 04:00 to 16:00 New York time. |
| The price part is zero in the morning | This is expected. The SPX index is not quoted before 09:30 New York time, so there is no price to revalue the position, and the whole change in delta comes from trades. |
| Past sessions have no two parts | The split is not available for every session in the history. The main line is still drawn. If the parts are enabled, the status line reports this. |
| Values differ on different timeframes | They should not. Each bar shows the position at the close of that bar, and the current bar shows the current minute. |
Was this article helpful?
That’s Great!
Thank you for your feedback
Sorry! We couldn't be helpful
Thank you for your feedback
Feedback sent
We appreciate your effort and will try to fix the article