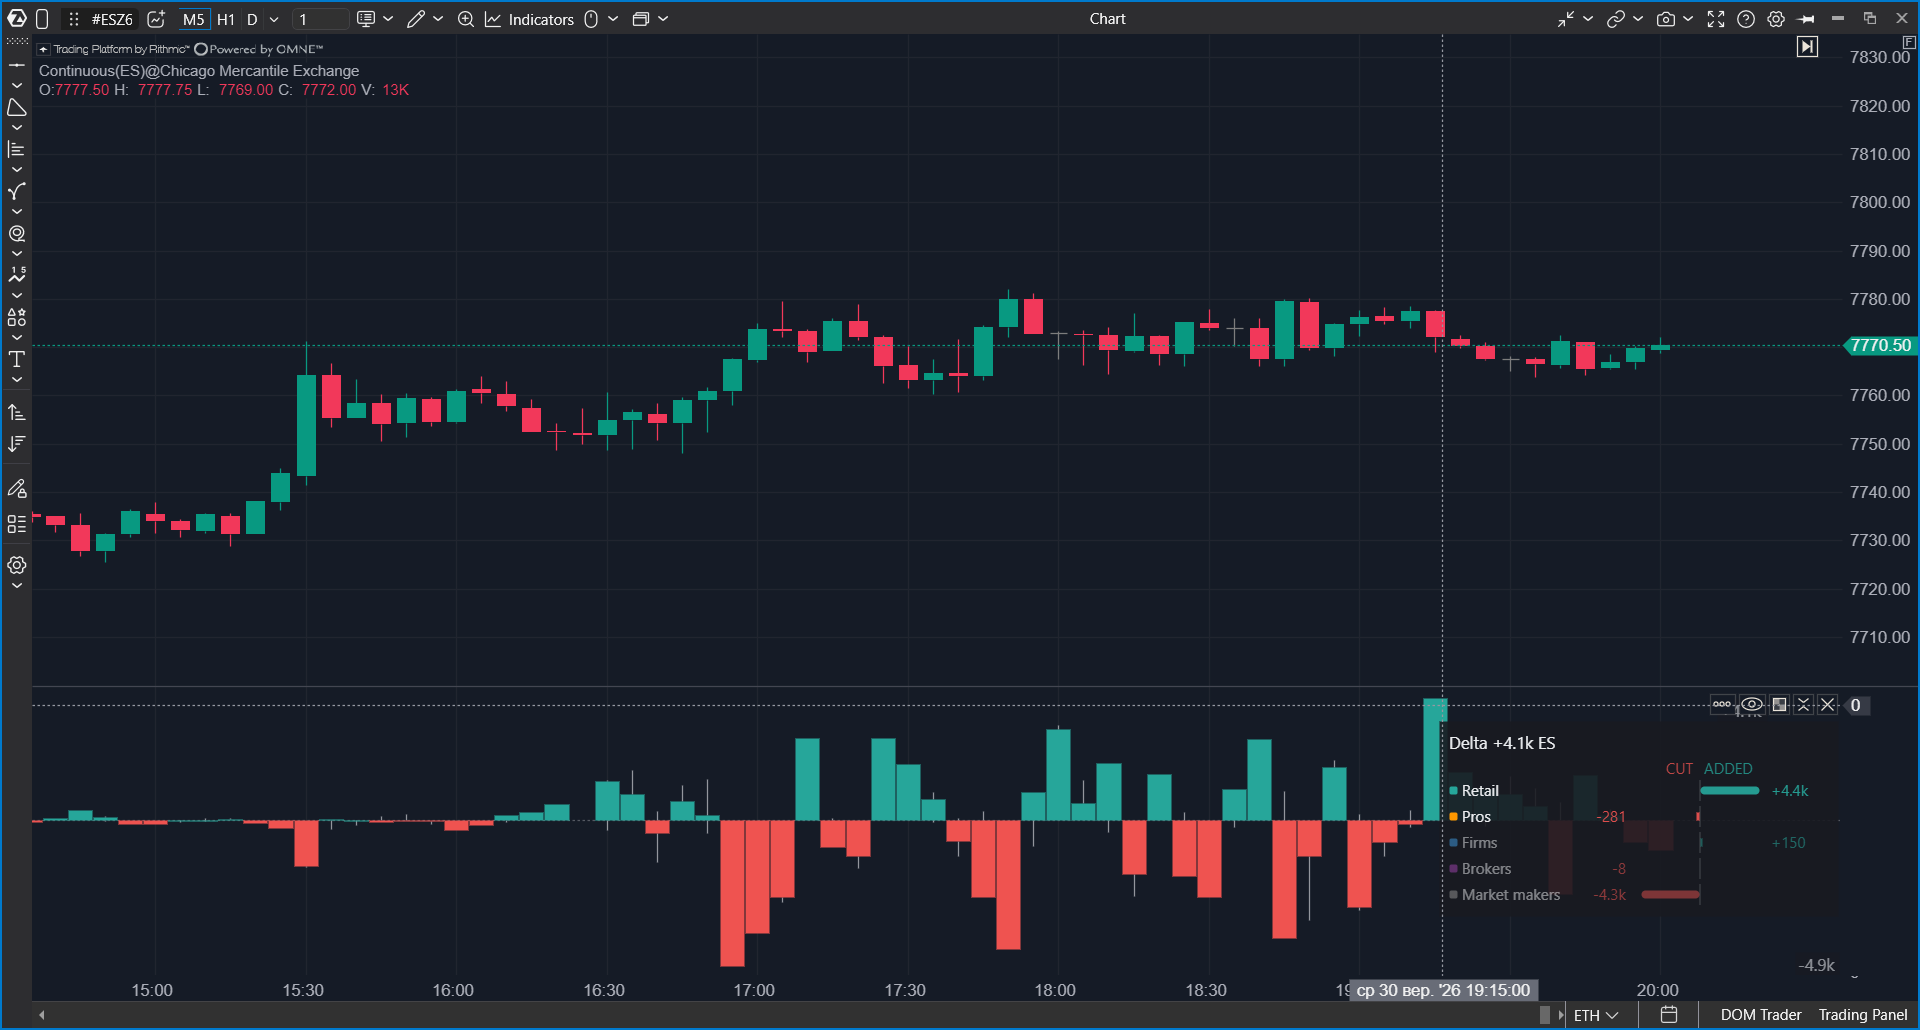
Options X-Ray: Flow Delta shows below an ES, MES, SPY, or US 500 chart which direction S&P 500 options positions shifted during each bar. A column above zero means positions shifted toward upside exposure. A column below zero means positions shifted toward downside exposure. A second mode shows the same data as a cumulative total from the start of the session.
It is similar to delta, but for the options market and for selected participant groups.
 Why Use It
Options X-Ray: Flow shows how much exposure was repositioned and who did it. Flow Delta answers the next question: where positions shifted by the end of the bar. Retail traders, professionals, and firms often have different goals, so the direction of their positioning helps form a market hypothesis.
By default, the indicator combines Retail and Pros. These groups are often on different sides of the market: retail traders buy protection or cheap lottery-like options, while professionals may sell them. Their combined balance shows the direction of demand.
Flow Delta helps answer questions such as:
- Are participants currently pushing exposure toward the upside or downside?
- Who is winning for the session so far?
- When did morning pressure start to reverse?
- Are traders focused only on today's options, or are they building positions for later in the week?
Flow Delta is not a trading signal. It shows where positions shifted, but not why participants shifted them. Confirm entries with futures tape, clusters, and delta.
What You Should Know Before You Start
| Chart | Use an ES, MES, SPY, or US 500 chart. ES and MES work with any specific contract, for example ESZ5. The data is OptionsDepth analytics derived from CBOE market data for S&P 500 index (SPX) options. The indicator is drawn in a separate panel below the chart. |
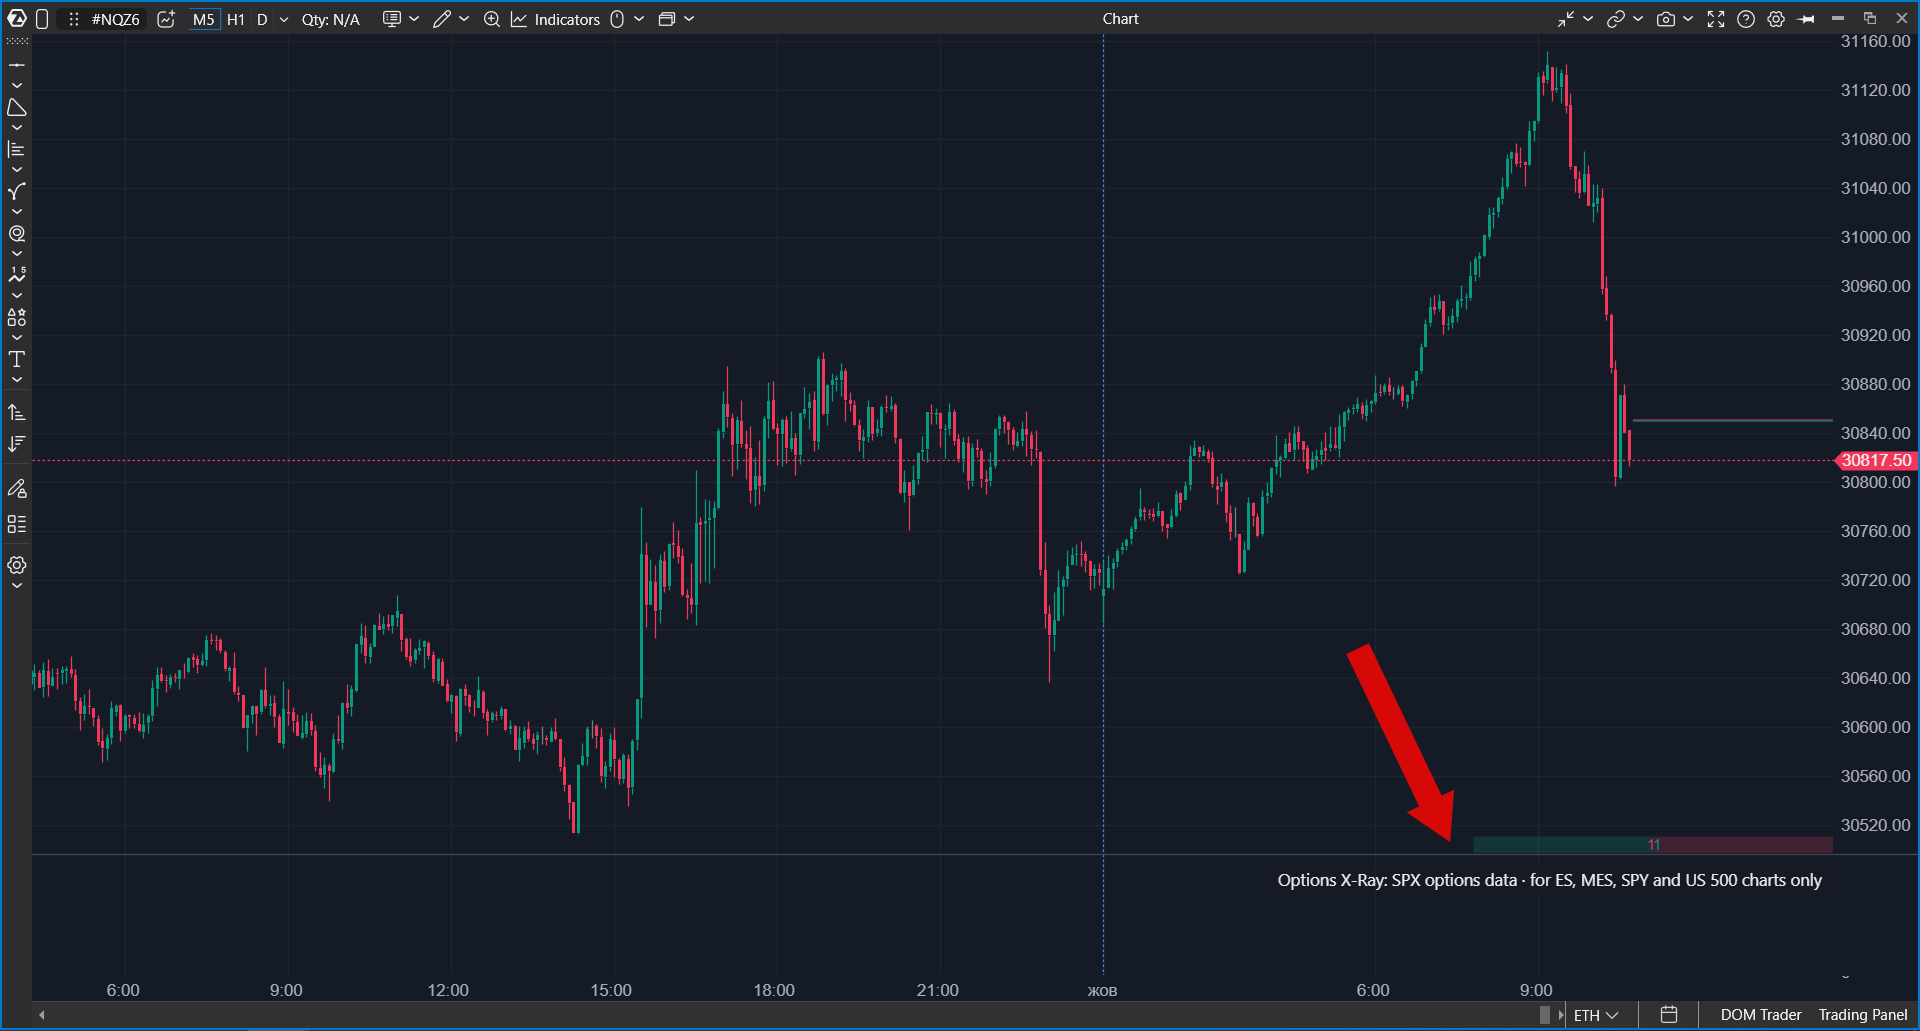
| Other markets | On any other instrument (NQ, oil, gold, individual stocks, crypto) the indicator draws nothing and shows an explanatory chip instead: Options X-Ray: SPX options data · for ES, MES, SPY and US 500 charts only. |
| Update frequency | The data updates once per minute. A chart bar combines all minute-level changes that fall inside that bar. |
| Units | Values are shown in ES contracts, not in option contracts. They show how much position risk changed when converted into ES futures exposure. |
| Access | Options X-Ray indicators are part of a separate package. If the indicator is not in the list, check whether the package is enabled in your account. |
| Data | Built on minute-level SPX options positioning analytics derived from CBOE market data. Data & analytics by OptionsDepth. |
How to Read the Columns
| Element | Meaning |
| Column above zero | By the end of the bar, the selected groups shifted positions toward upside exposure. |
| Column below zero | By the end of the bar, the selected groups shifted positions toward downside exposure. |
| Height | How strongly positions shifted during the bar. |
| Wick | How far positions moved inside the bar before reaching the final value, similar to a regular candle wick. |
A long wick with a short column means positions moved strongly inside the bar and then returned. There was activity, but no clear winner.
Per Bar and Cumulative Modes
The mode is controlled by the Mode setting.
| Mode | What it shows | Question it answers |
| Per bar | One separate column for each chart bar. This is the default. | Where pressure is right now. |
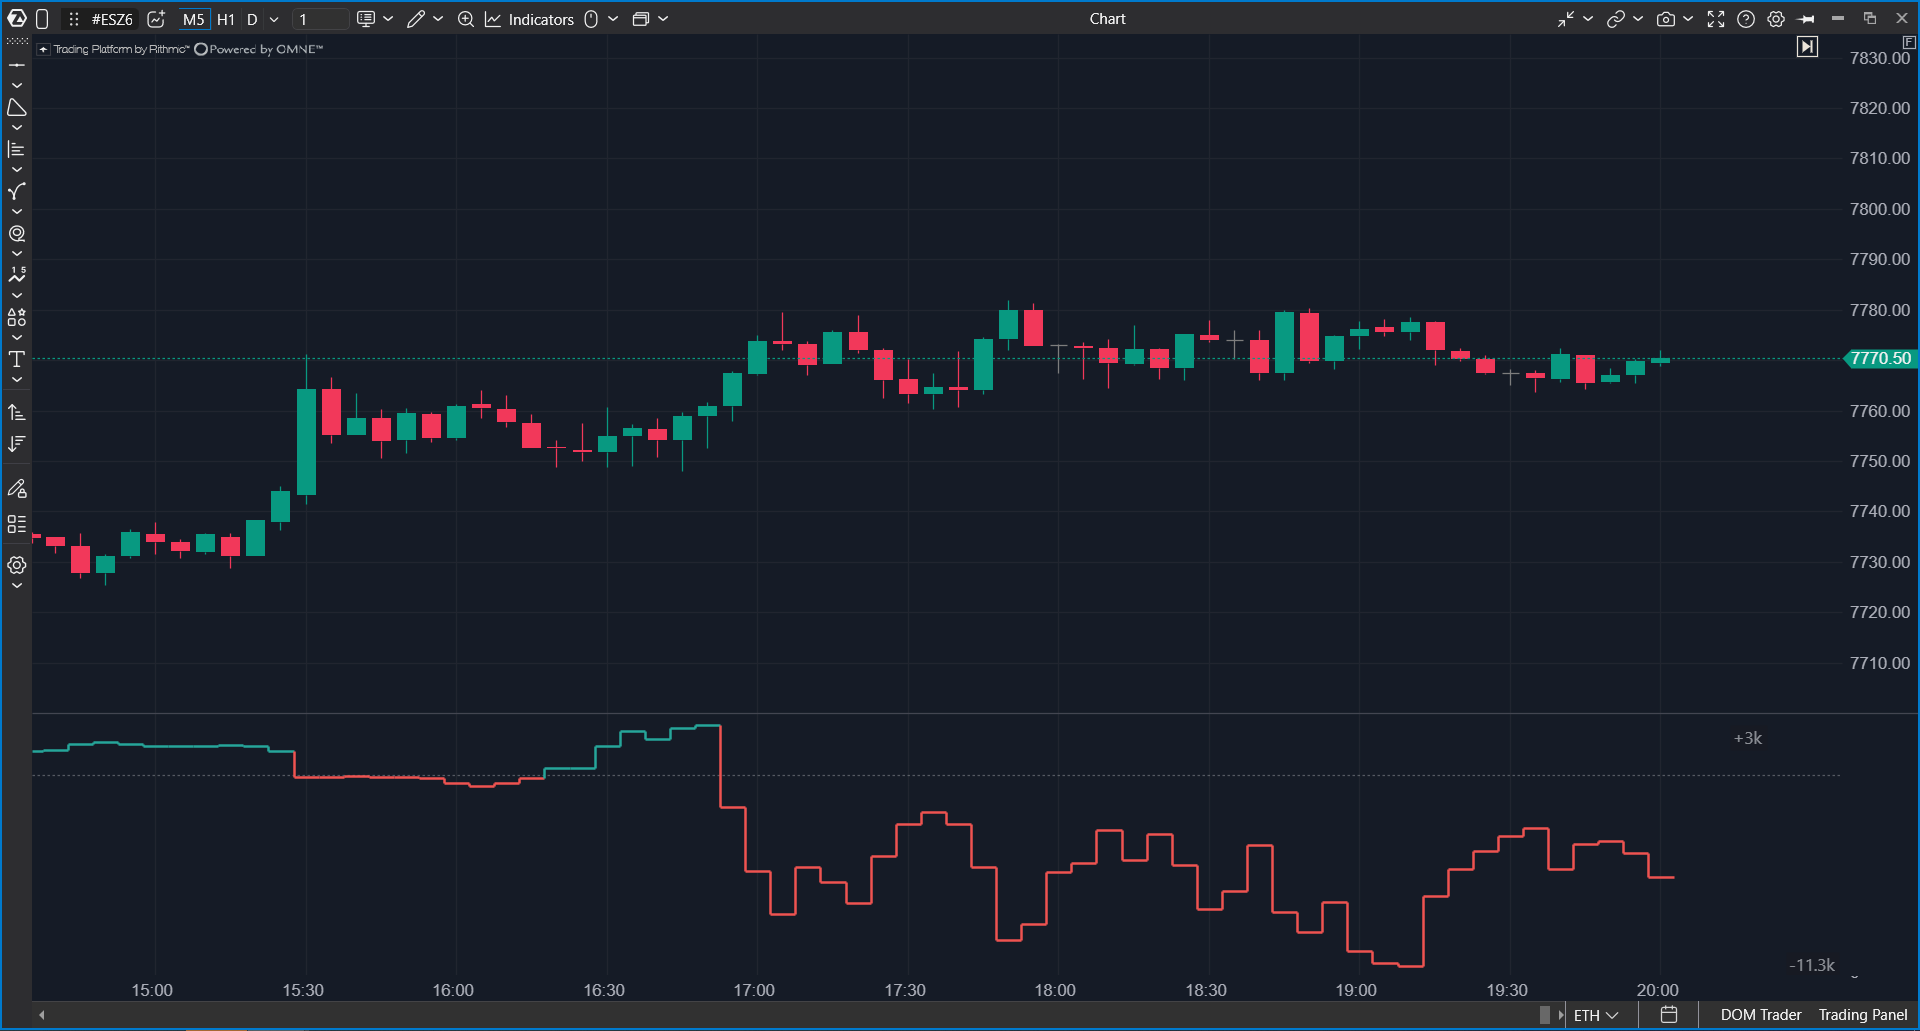
| Cumulative | A step line showing the sum of all changes from the start of the session. Wicks show how far the cumulative value moved inside the bar. | Who is winning for the session and when pressure started to reverse. |
Cumulative mode is useful for seeing turns. For example, positions may shift one way in the morning and then reverse by midday.
 Comparing Expirations
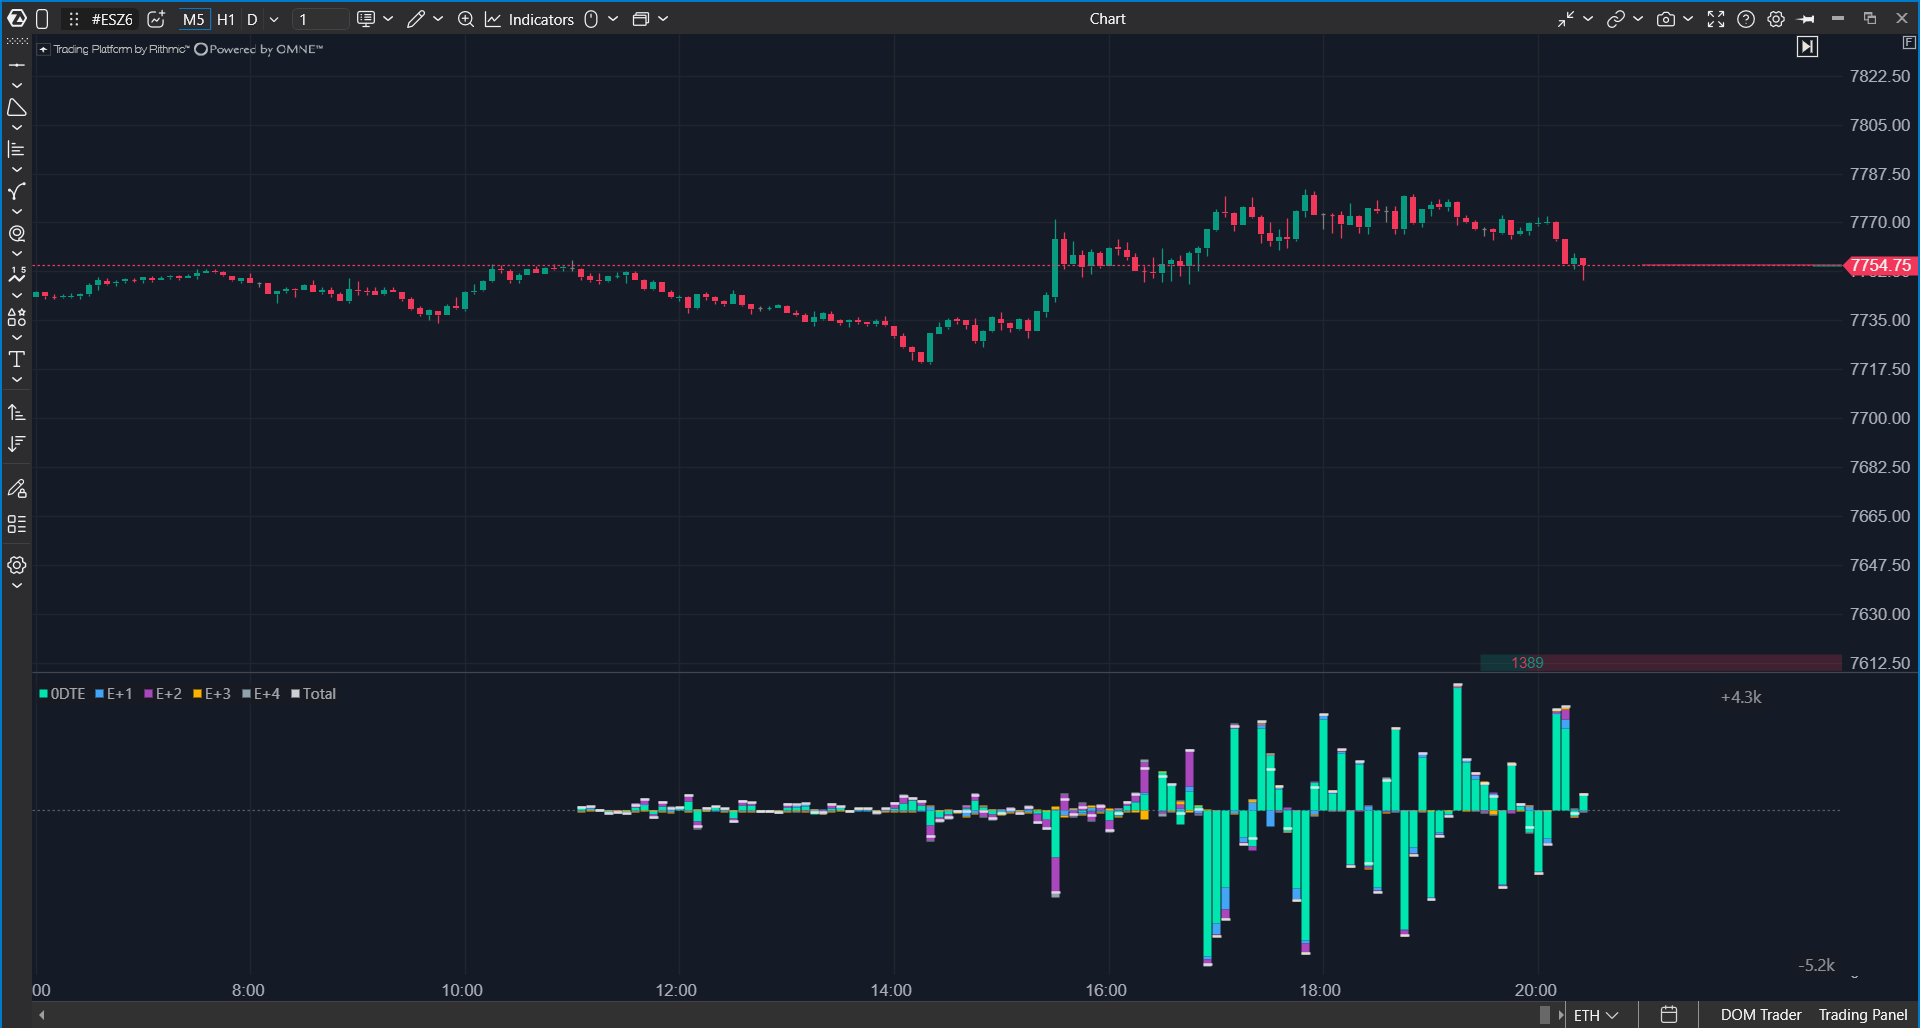
The Expirations list includes several Split modes. They show several option expiration groups next to each other, each with its own color, plus their total.
| Split mode | What it compares |
| Split: 0DTE + next expiration | Options expiring today and options from the nearest next expiration. |
| Split: 0DTE + rest of week | Today's options versus all other expirations through the end of the week. |
| Split: week by day | The whole week by day: today and the next four expiration dates, plus the total line. |
In Split modes, color shows expiration date, not direction. Direction is read from whether the column segment is above or below zero.
| Color | Expiration |
| Mint | Options expiring today. |
| Blue | First date after today. |
| Purple | Second date after today. |
| Amber | Third date after today. |
| Gray | Fourth date after today. |
| White line | Total of all selected expirations. |
In Per bar mode, the parts are stacked into one column: positive parts go up, negative parts go down, and the total is shown on top. In cumulative mode, each expiration group has its own step line.
If today's line moves strongly while other lines are flat, activity is focused on today's options. If today's options are flat while later dates move, participants may be building positions ahead of time for the middle of the week.
 Tooltip Card
Hover over a column to open a card with a breakdown by participant group.
The card shows how much and in which direction each group shifted positions during the bar. This helps identify which group contributed most to the column.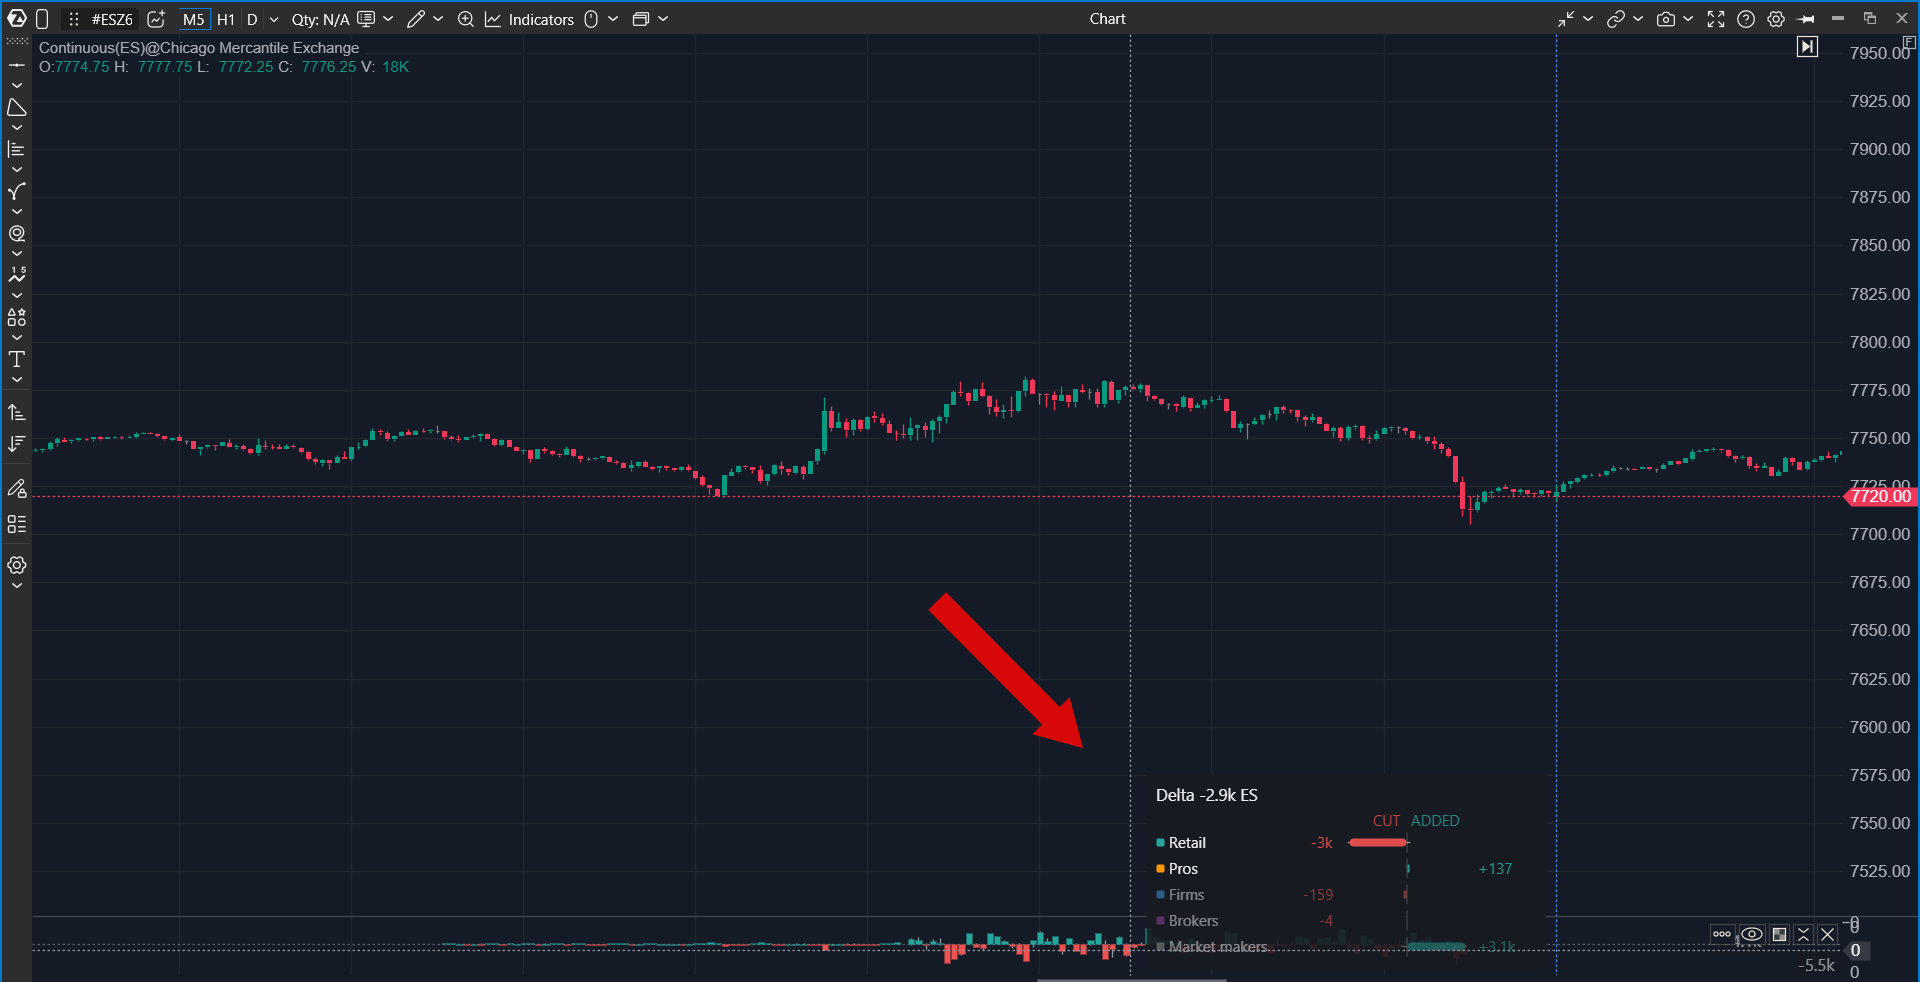
How to Add the Indicator
- Open an ES, MES, SPY, or US 500 chart.
- Click Indicators on the top panel.
- Select the Options Analytics group or type Options in search.
- Select Options X-Ray: Flow Delta.
- Click Add to chart.
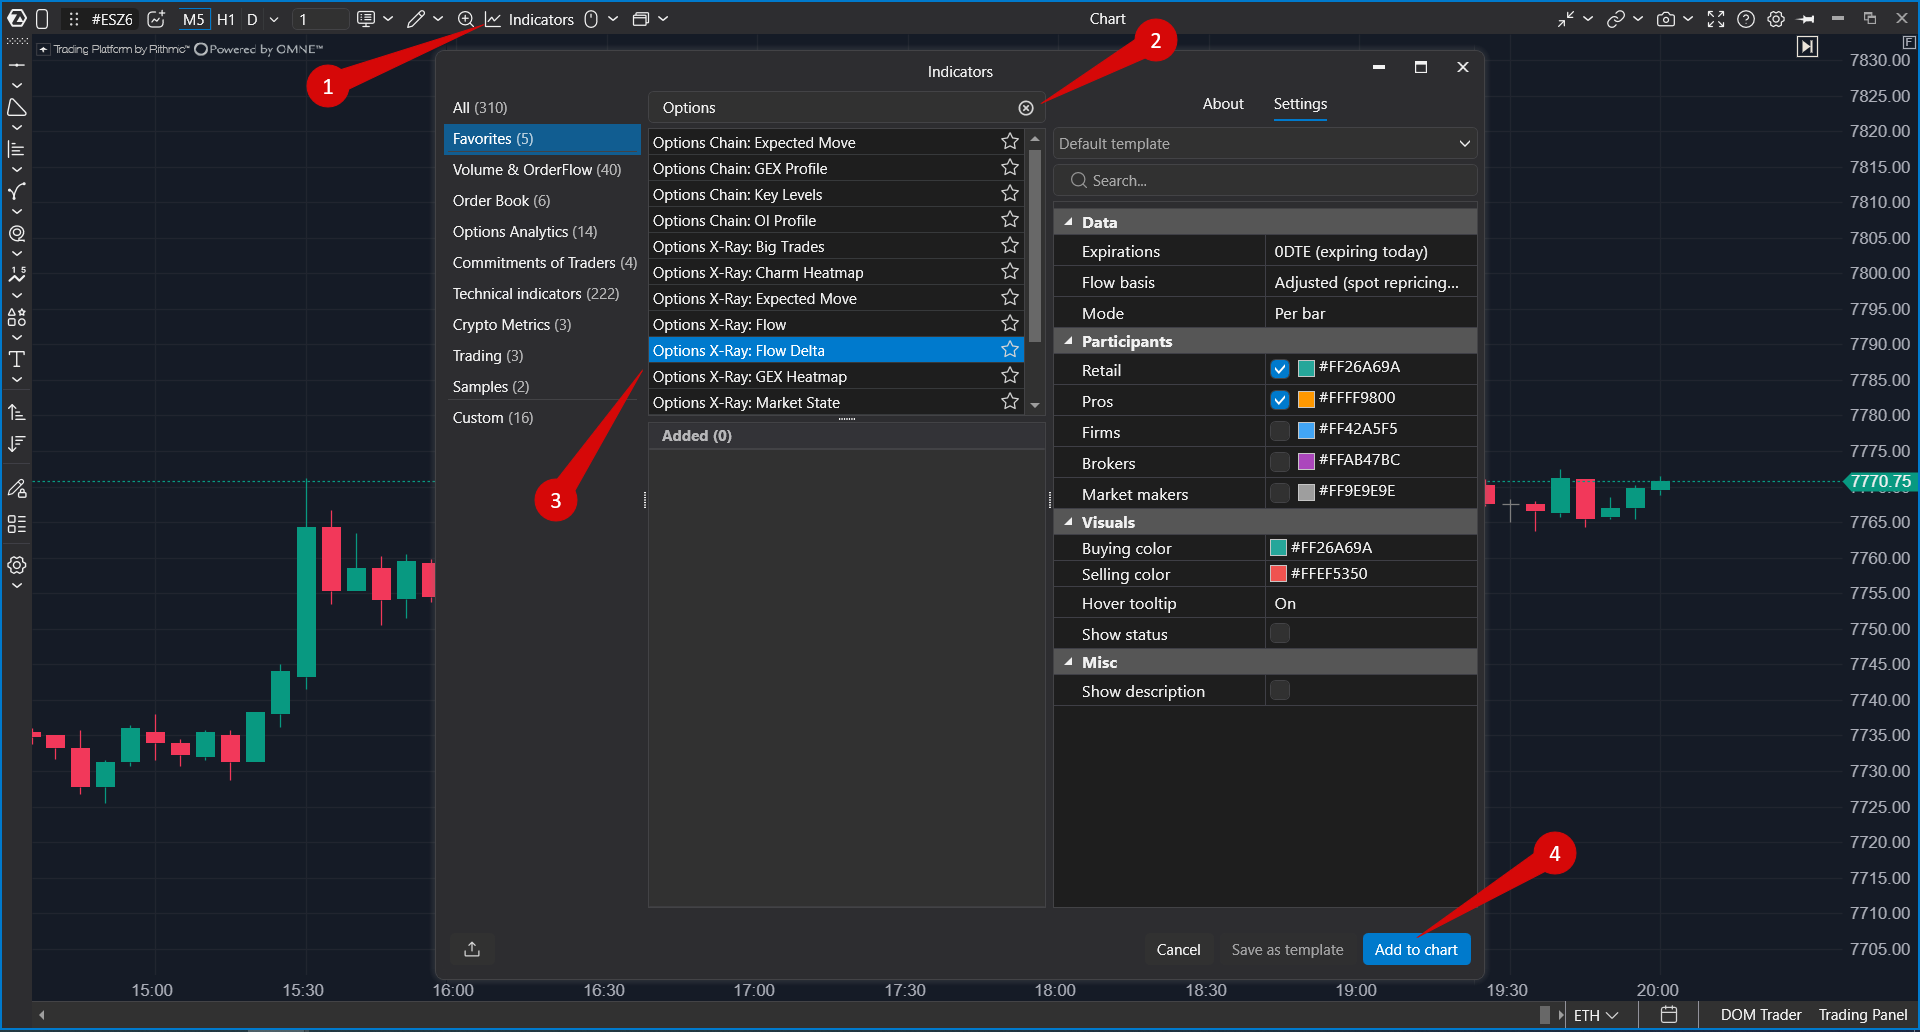 To change settings later, open Indicators again, select the indicator in the Added section, and click Apply.
Settings
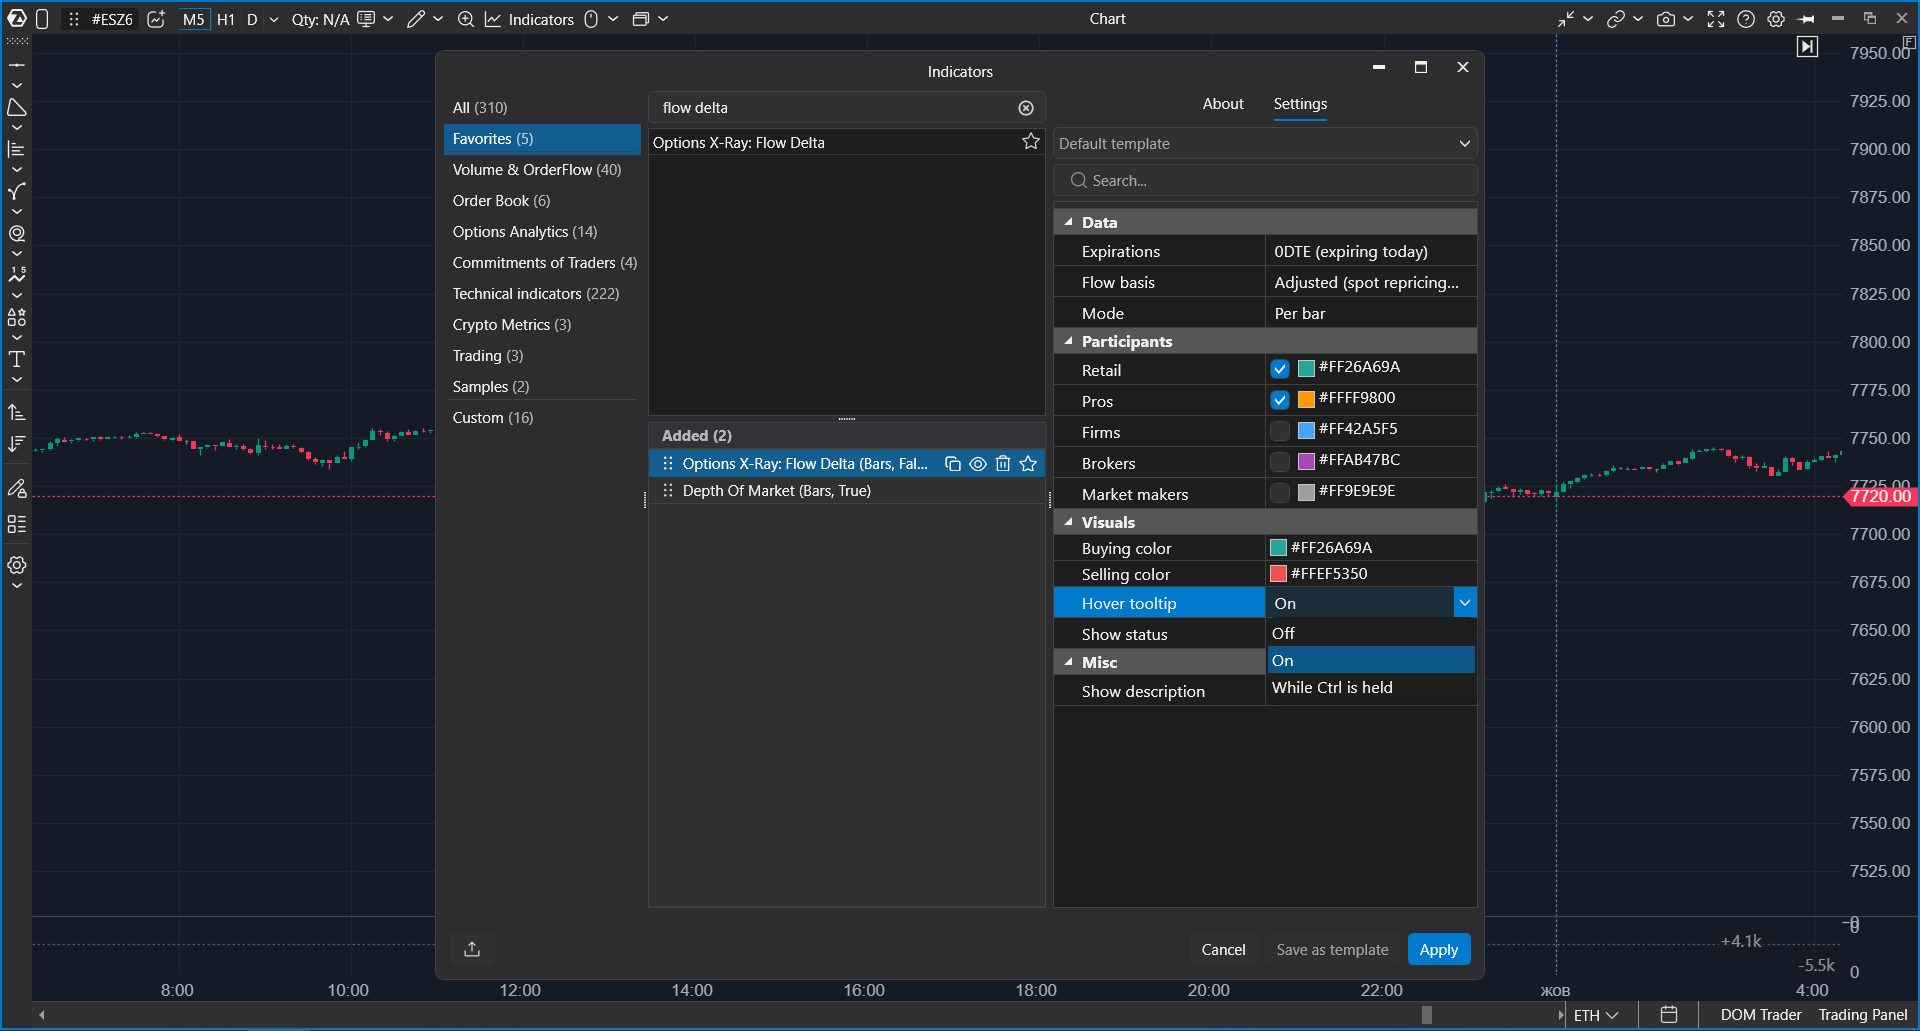
| Setting | What it does |
| Expirations | Selects which option expirations are included. The default is 0DTE, options expiring today. Split items compare several dates. |
| Flow basis | Defines how position changes are calculated. The default is Adjusted. If you compare several charts or indicators, use the same value everywhere. |
| Mode | Selects Per bar or cumulative mode. |
| Retail, Pros | Retail traders and professional clients. Enabled by default and combined into one value. |
| Firms, Brokers | Funds and brokers. Disabled by default. Enable them to add them to the total or isolate them. |
| Market makers | Disabled by default. Market makers are the other side of other groups' trades, so including them can make the total less meaningful. |
| Buying color | Color for columns when positions shifted toward upside exposure. The default is green. |
| Selling color | Color for columns when positions shifted toward downside exposure. The default is red. |
| Hover tooltip | Controls the hover card: Off, On (default), or While Ctrl is held. The Ctrl mode keeps the chart clean and shows the card only on demand. |
| Show status | Shows the indicator status line. It is disabled by default. |
| Show description | Shows a short indicator description on the panel. It is disabled by default. |
Each group selection answers a different question. Retail only shows retail pressure. Pros only shows professional clients. Firms only shows funds and institutions. Retail plus Pros shows the broad demand balance.
How to Work With the Indicator
Flow Delta is the second of three indicators that show participant activity.
| Indicator | Question |
| Options X-Ray: Flow | How much exposure was repositioned during the bar and by whom? |
| Options X-Ray: Flow Delta | In which direction did positions shift? |
| Options X-Ray: Big Trades | Who acted, at which strike, and by how much? |
- Switch to cumulative mode and check where pressure has moved from the start of the day.
- Find the turn: the place where the line started to reverse.
- Return to Per bar mode and inspect columns and wicks around the turn.
- Leave one group enabled to see who reversed.
- Use Big Trades to see at which strike the change happened, then check how price reacted.
Troubleshooting
| What happens | What to do |
| The indicator is not in the list | Check whether the Options X-Ray package is enabled in your account. |
| The panel is empty, and the chart shows the chip "Options X-Ray: SPX options data · for ES, MES, SPY and US 500 charts only" | The chart instrument is not supported. Open an ES, MES, SPY, or US 500 chart. |
| The panel is empty on a supported chart | Make sure at least one participant group is enabled. During weekends and holidays there is no new data, but previous sessions should still be displayed. |
| A day is not drawn in Split mode | One of the selected expiration dates has no data for that day. The indicator avoids drawing an incorrect total. |
| Values differ from Flow | Flow shows turnover, while Flow Delta shows the final net shift. Also, by default Flow Delta includes only Retail and Pros. |
| The picture changed sharply on Friday morning | If it is the third Friday of the month and 0DTE is selected, the indicator may switch from monthly options to weekly options after the monthly series settles at 09:15. This is expected. |
| Values differ from another chart | Compare Expirations, Flow basis, Mode, and enabled participant groups. They should match. |
Was this article helpful?
That’s Great!
Thank you for your feedback
Sorry! We couldn't be helpful
Thank you for your feedback
Feedback sent
We appreciate your effort and will try to fix the article