The Options Strategy Analysis module helps you model option strategies and review potential profit or loss depending on the underlying price, expiration, current date, volatility, and selected scenario prices.
What is Options Strategy Analysis?
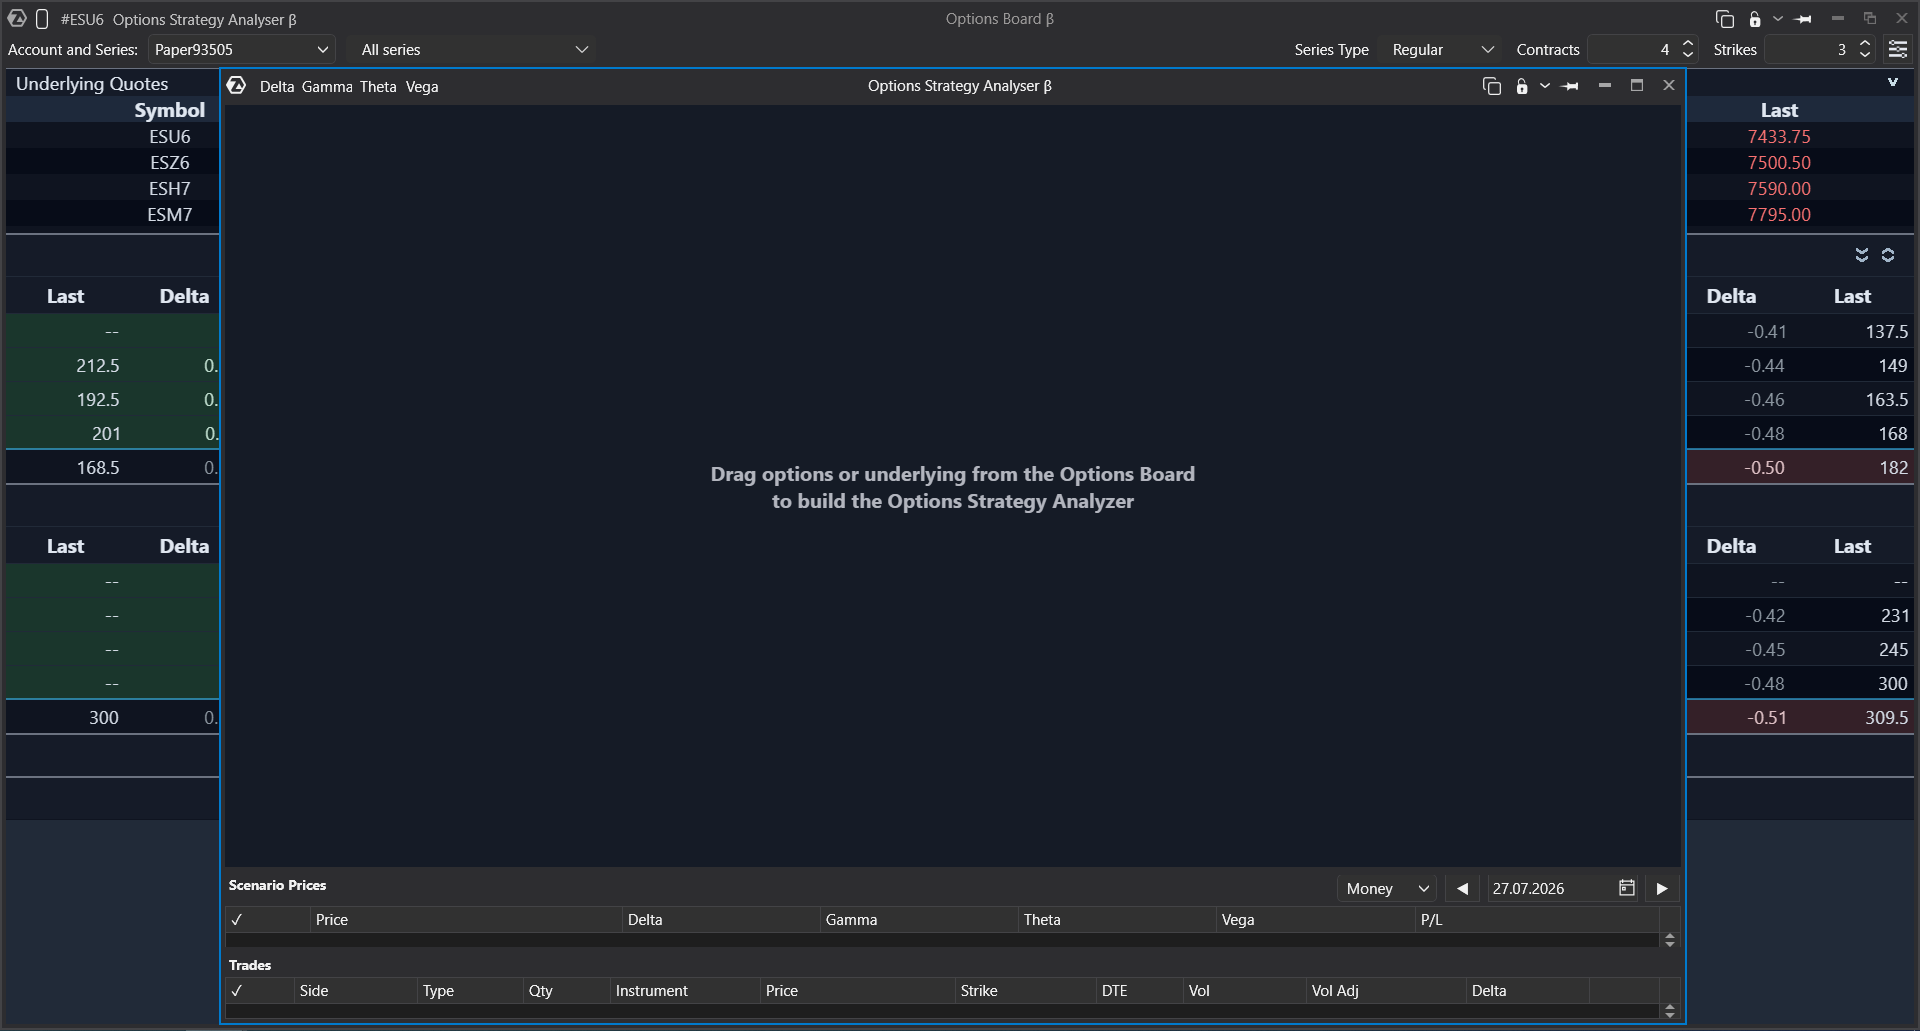
Options Strategy Analysis is a module for modeling profit and loss for options and option combinations. It opens from the Option Board and is empty by default until you add instruments to the strategy.
You can use it to analyze a single option, a multi-leg options strategy, or a combination of options and the underlying asset.
Before you start
Before using the module, make sure that:
- Option Board is available for your account and connector;
- the selected instrument has available options;
- option prices and volatility data are available from the connector;
- you understand that modeled values are estimates based on the selected inputs.
How to open Strategy Analysis
- Open the Option Board.
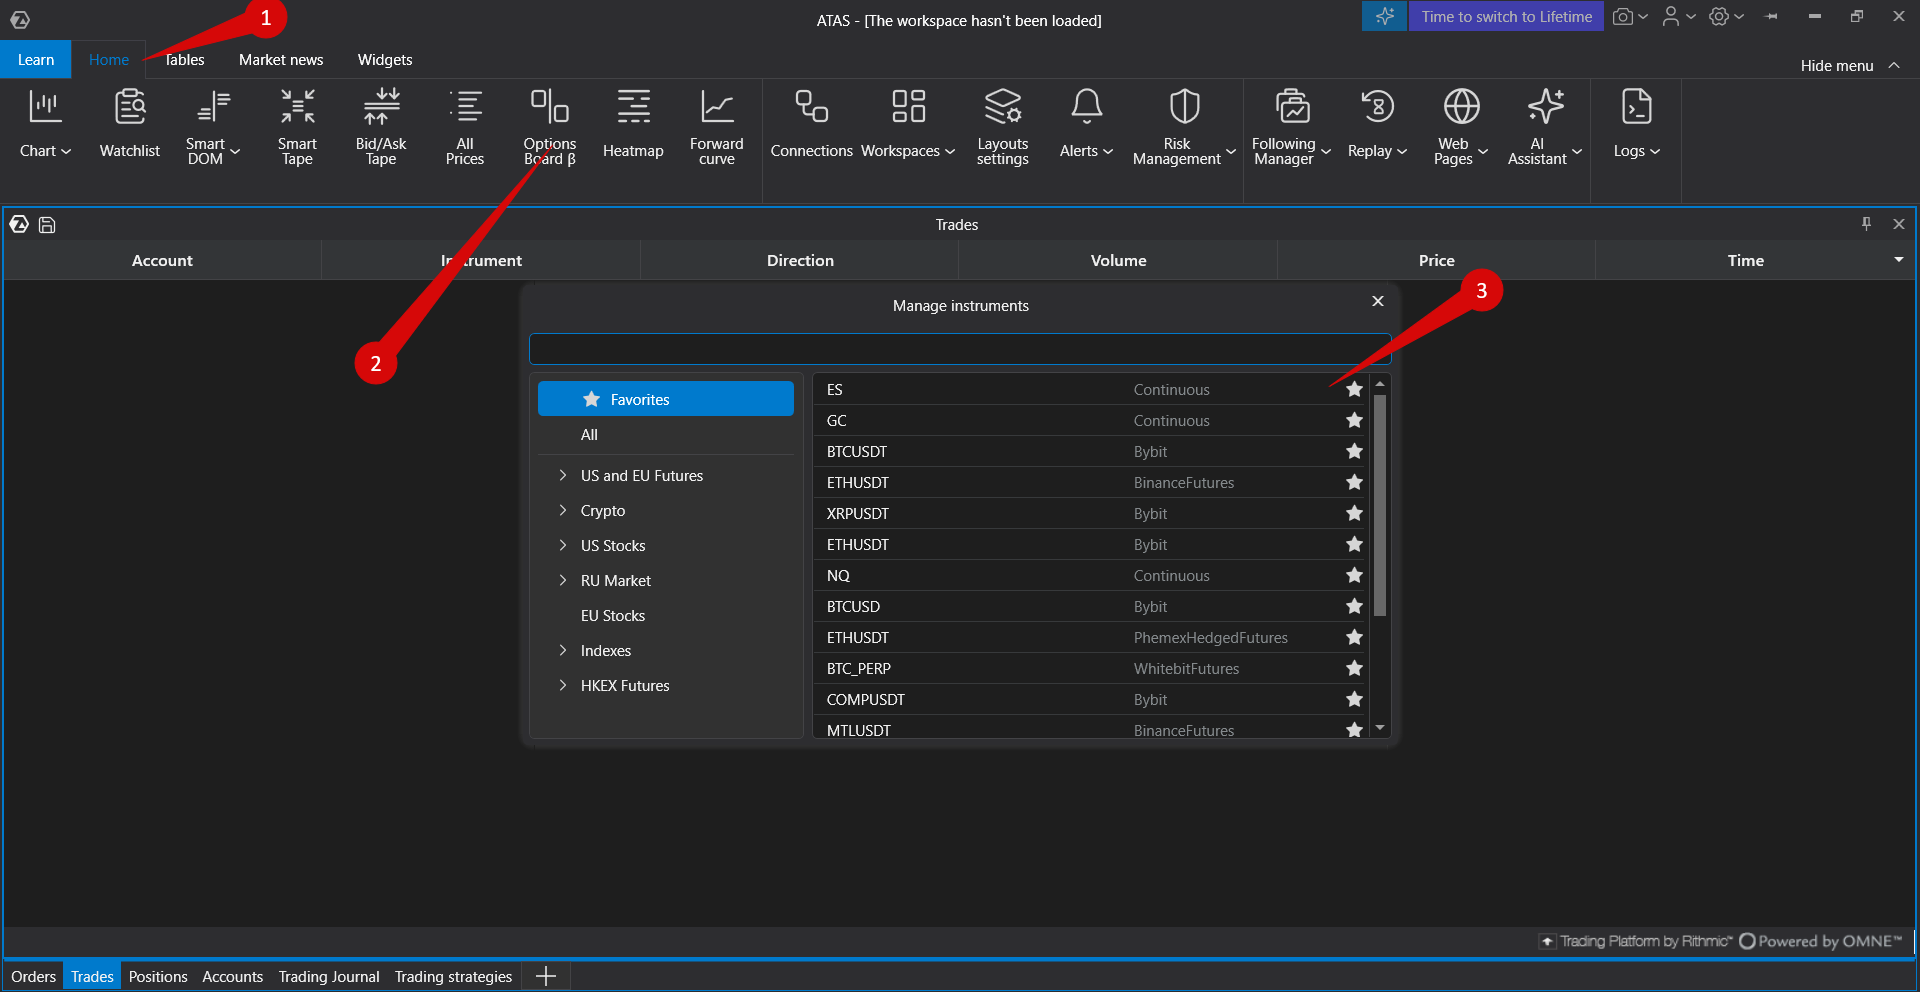
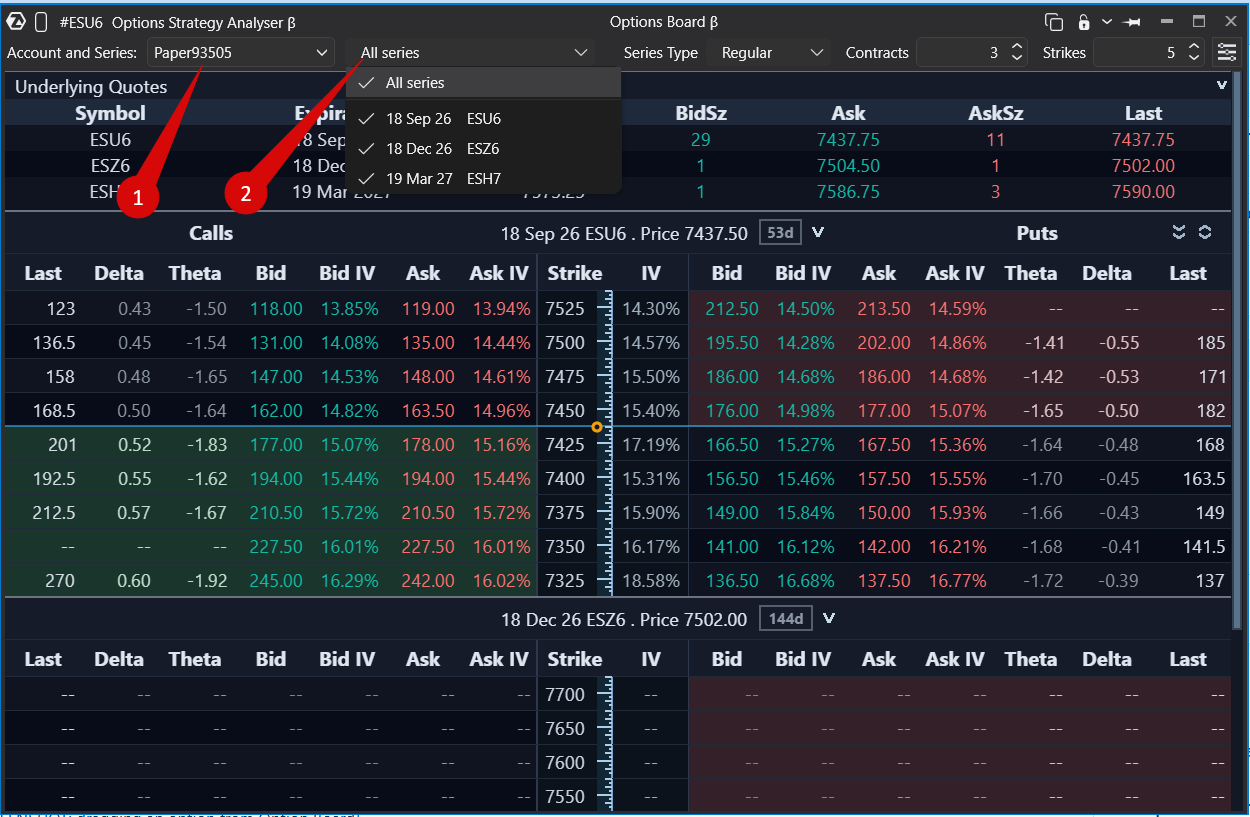
- Select an account.
- Select an option series or expiration.
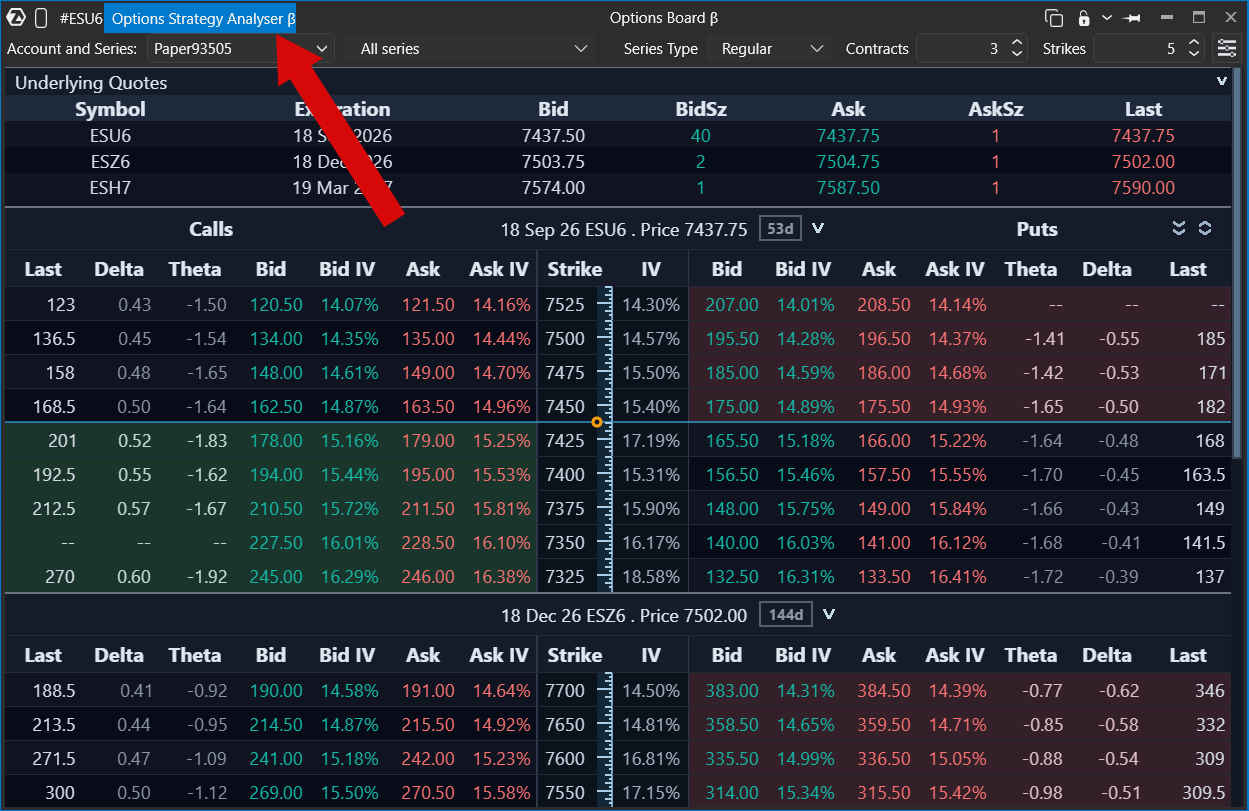
- Open the Strategy Analysis module from the Option Board window.
How to add an option to the strategy
- Find the option you want to analyze in the Option Board.
- To model buying an option, drag it from the Ask price or Ask IV area.
- Drop the option into the Strategy Analysis module.
- Review the added position in the lower part of the module.
The position row can include:
- direction: Buy or Sell;
- option type: Call or Put;
- quantity;
- instrument;
- entry price;
- strike price;
- days to expiration;
- current volatility;
- Delta and other calculated values.
The default quantity is 1.
How to change direction and entry price
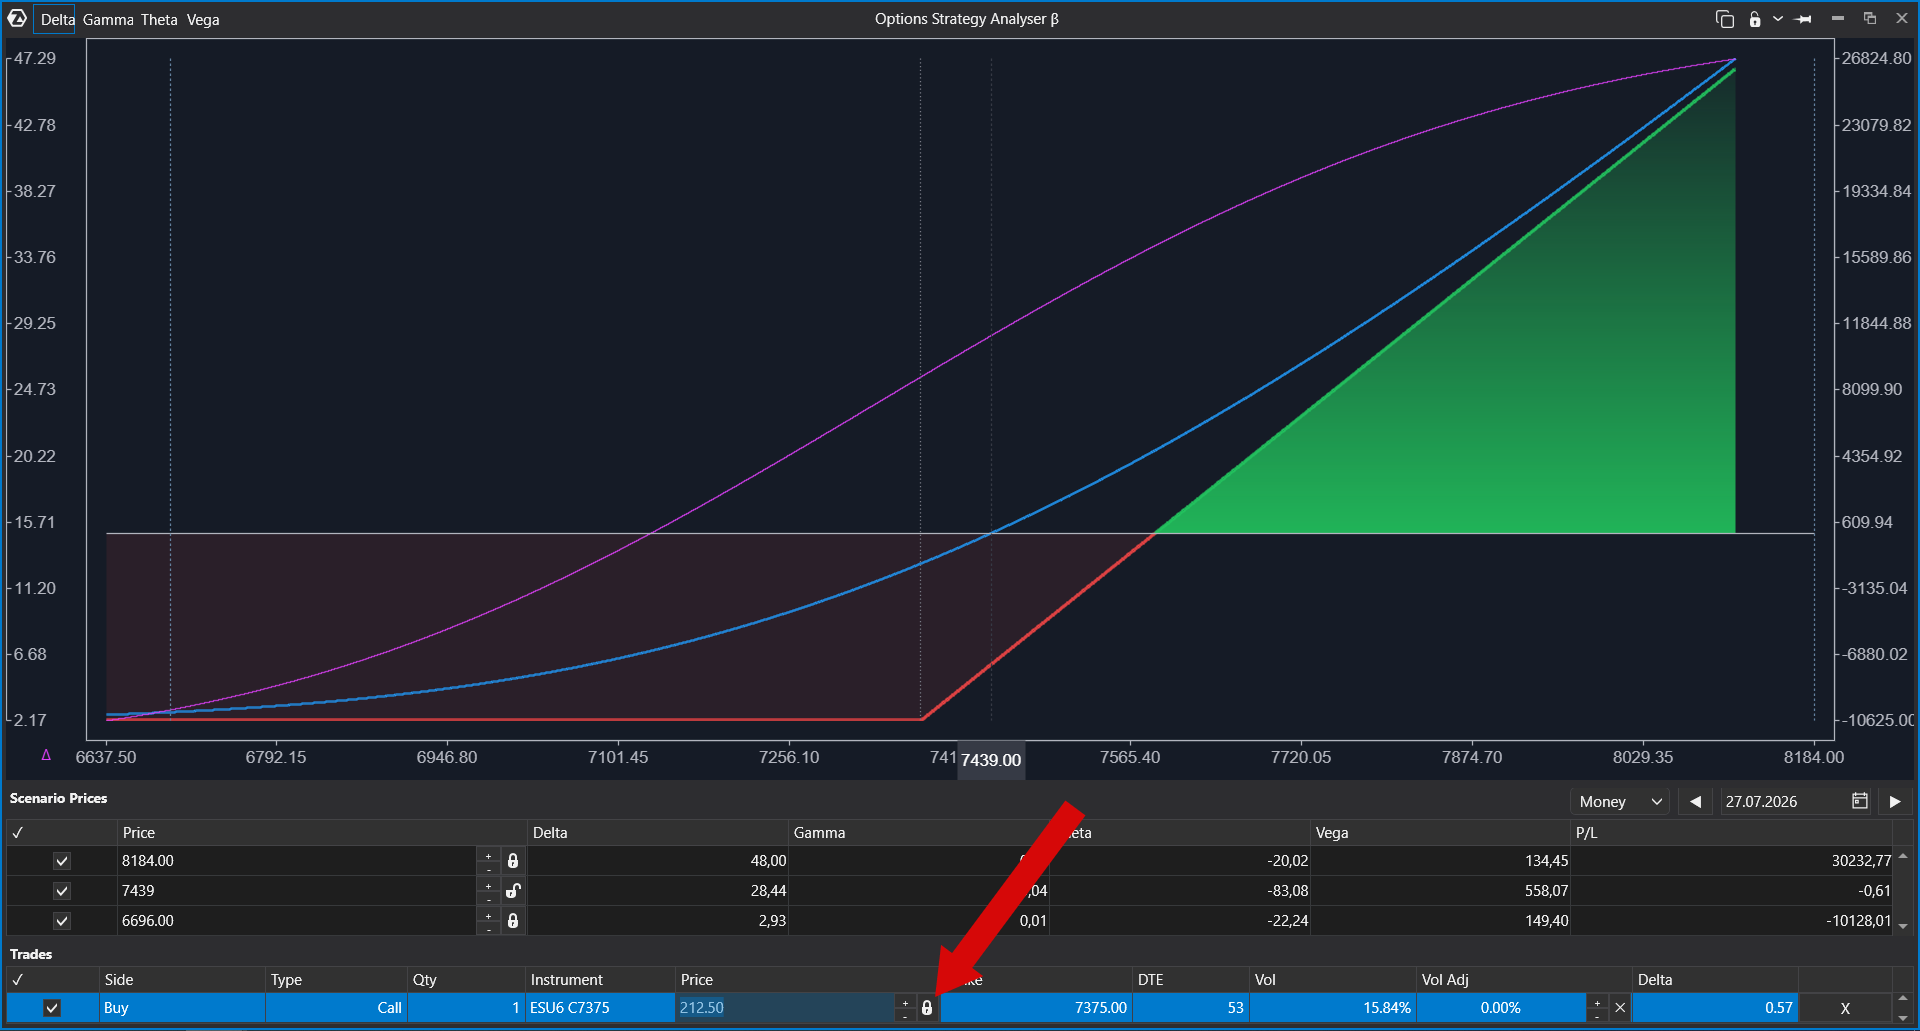
You can change whether an option is modeled as bought or sold. You can also lock or unlock the entry price.
- When the price is unlocked, it can update from the current market value.
- When the price is locked, the strategy is calculated from the fixed price you set.
Use a locked price if you want to analyze a position based on your actual execution price.
How to read the P&L chart
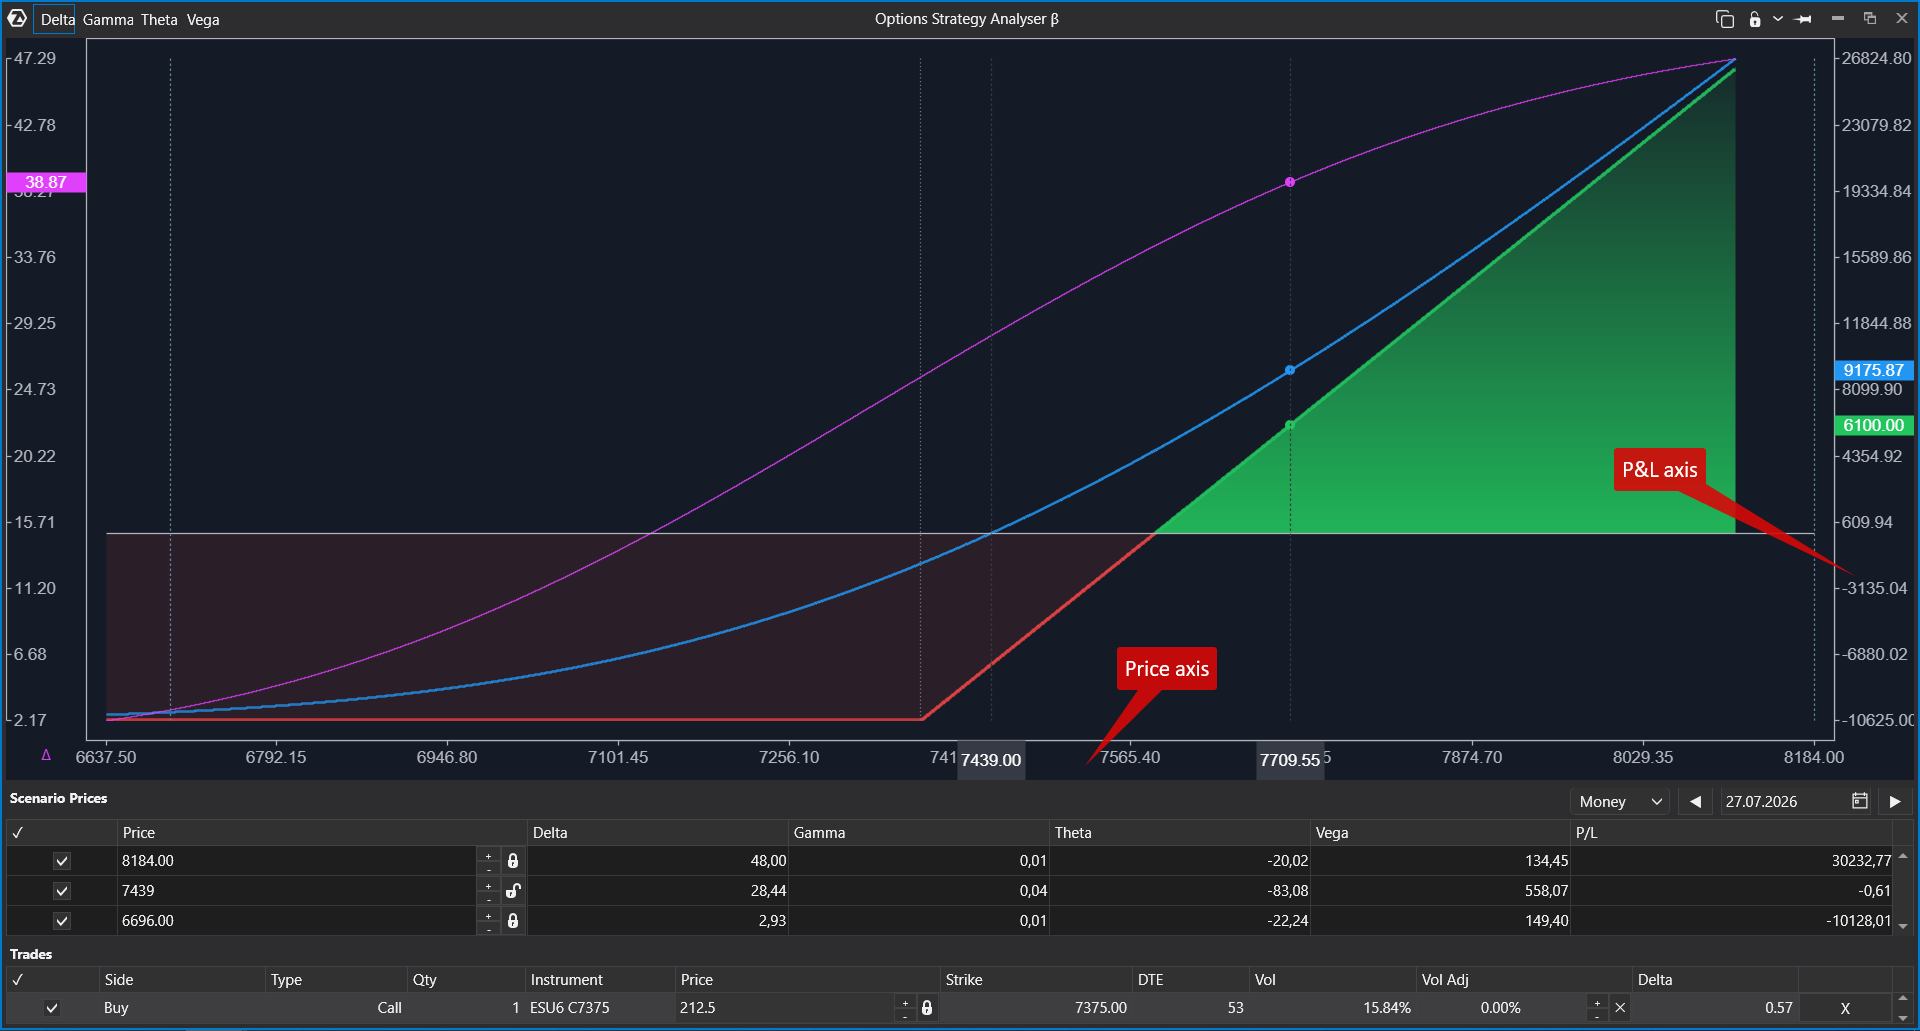
The chart shows the estimated profit or loss of the strategy.
- The horizontal axis shows the price of the underlying instrument.
- The vertical axis shows profit or loss.
This layout is different from regular price charts, where price is usually displayed on the vertical axis.
Expiration P&L line vs current P&L line
By default, the chart can show two lines:
- Expiration P&L line shows the estimated profit or loss if the underlying price reaches a selected level at option expiration.
- Current P&L line shows the estimated profit or loss if the underlying price moves to a selected level at the current moment.
Options are nonlinear instruments, so the result can differ depending on whether the price is reached today or later.
How breakeven is shown
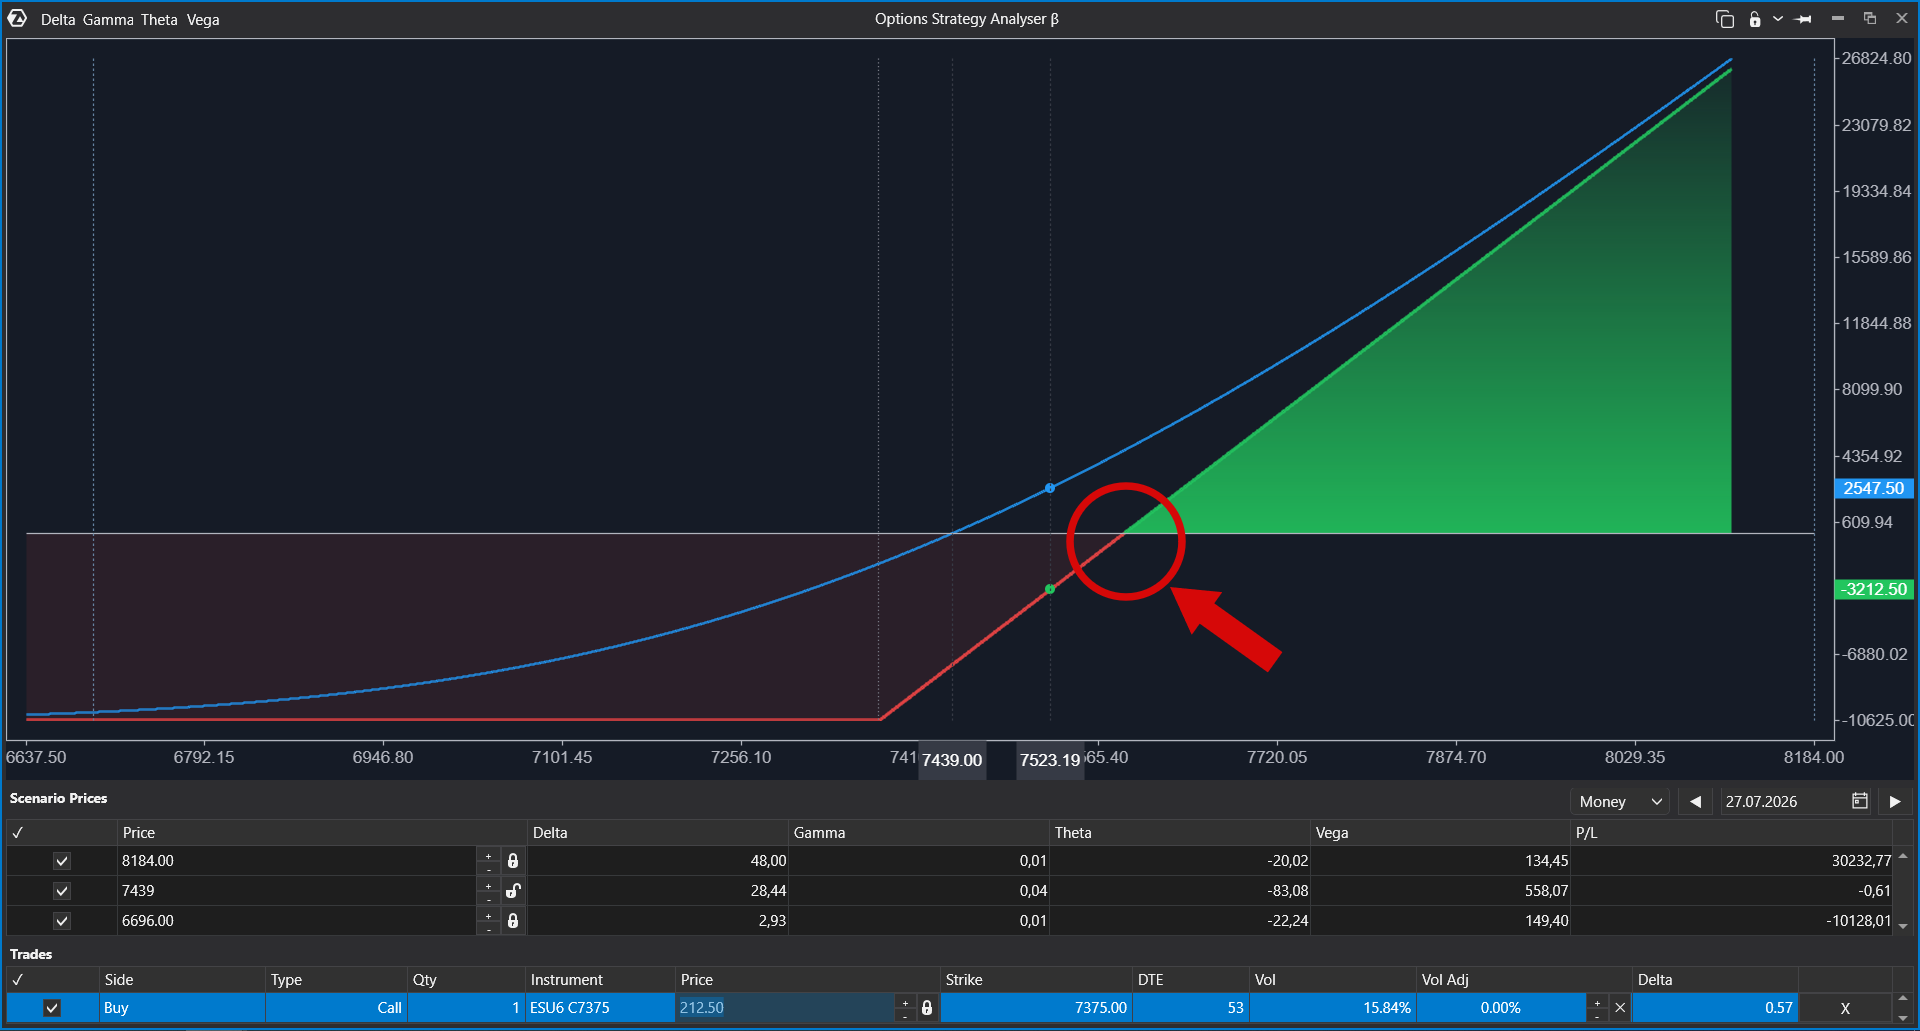
The breakeven level is the point where the expiration P&L line crosses the zero profit/loss line. On the chart, it is where the strategy changes from loss to profit. For a long Call, the breakeven level is approximately the strike price plus the paid premium. Breakeven: expiration P&L crosses zero.
How to add multiple options or the underlying asset
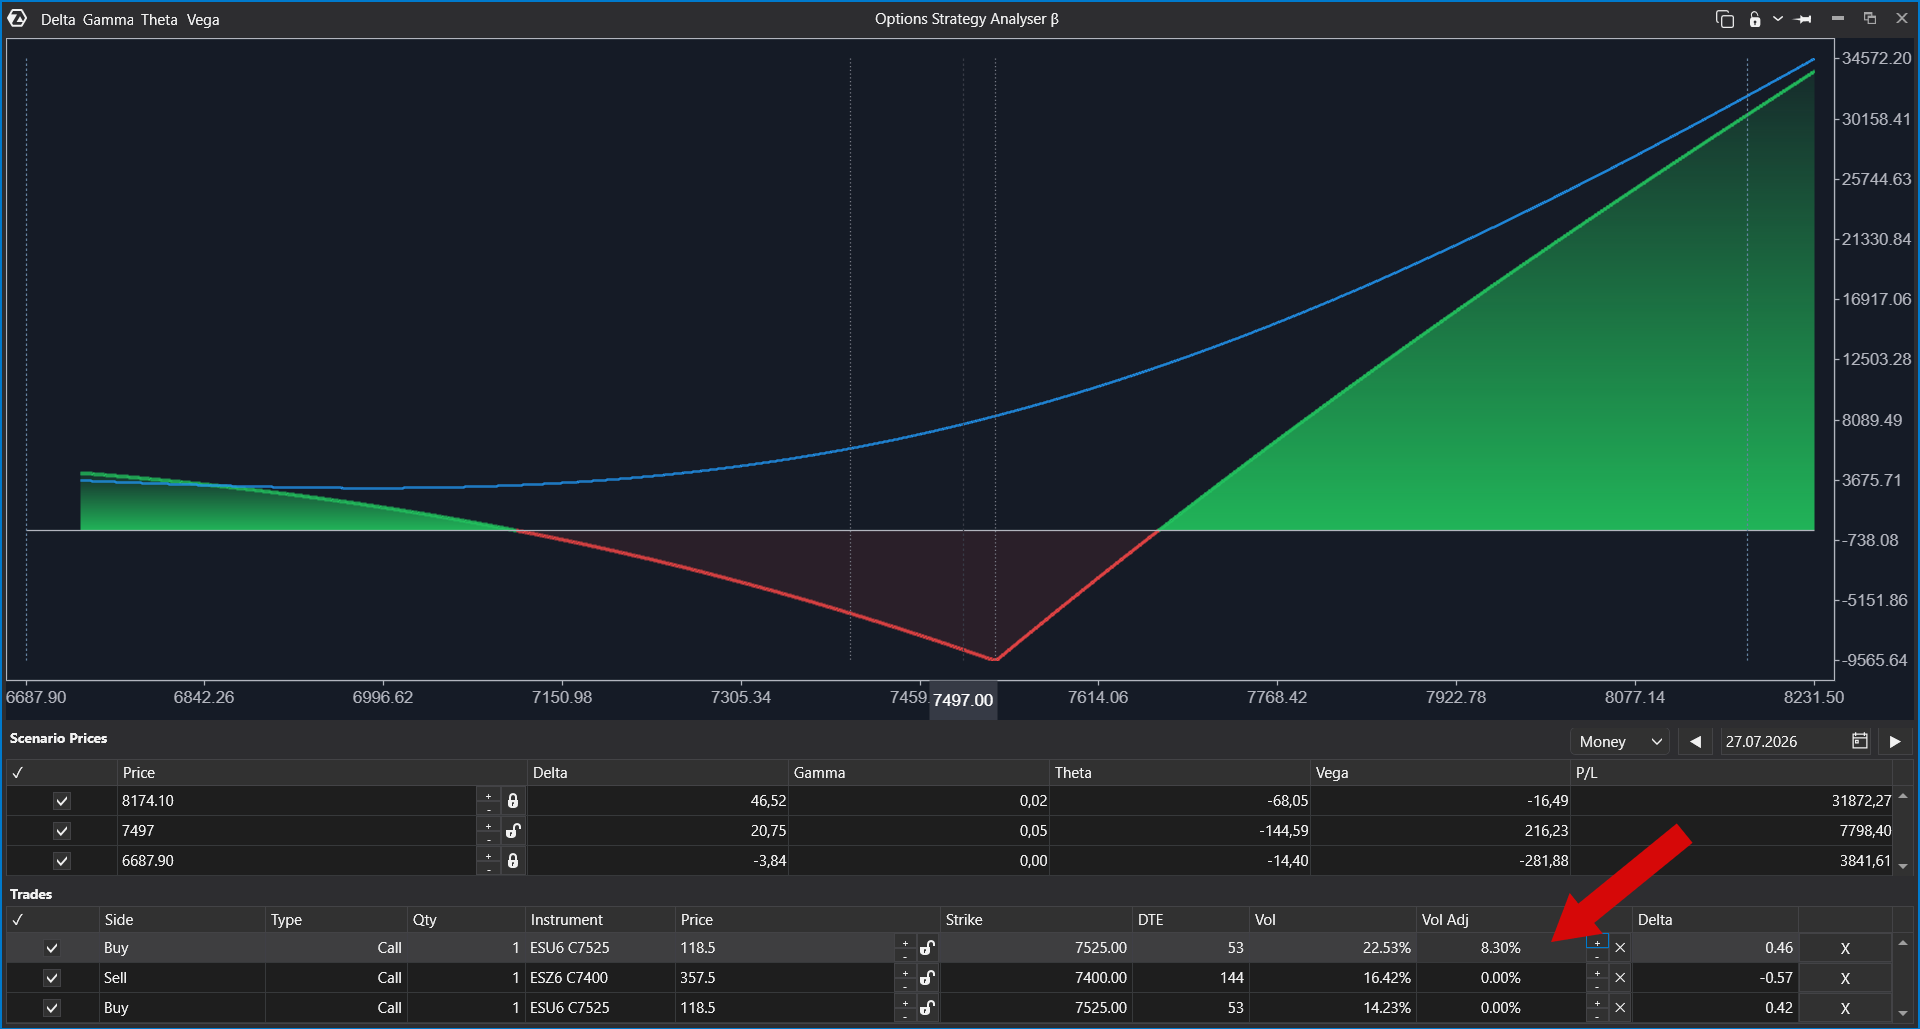
You can add multiple options to build option combinations. The chart recalculates each time you add, remove, or edit an instrument.
You can also add a buy or sell position in the underlying asset, such as a futures contract. This changes the overall strategy P&L chart.
How volatility affects the strategy
Volatility is an important parameter for options. By default, ATAS uses the current volatility value available for the option. You can adjust volatility manually to model how the strategy may behave under different volatility assumptions.
When volatility changes, the chart and calculated values are recalculated.
How analysis date affects the strategy
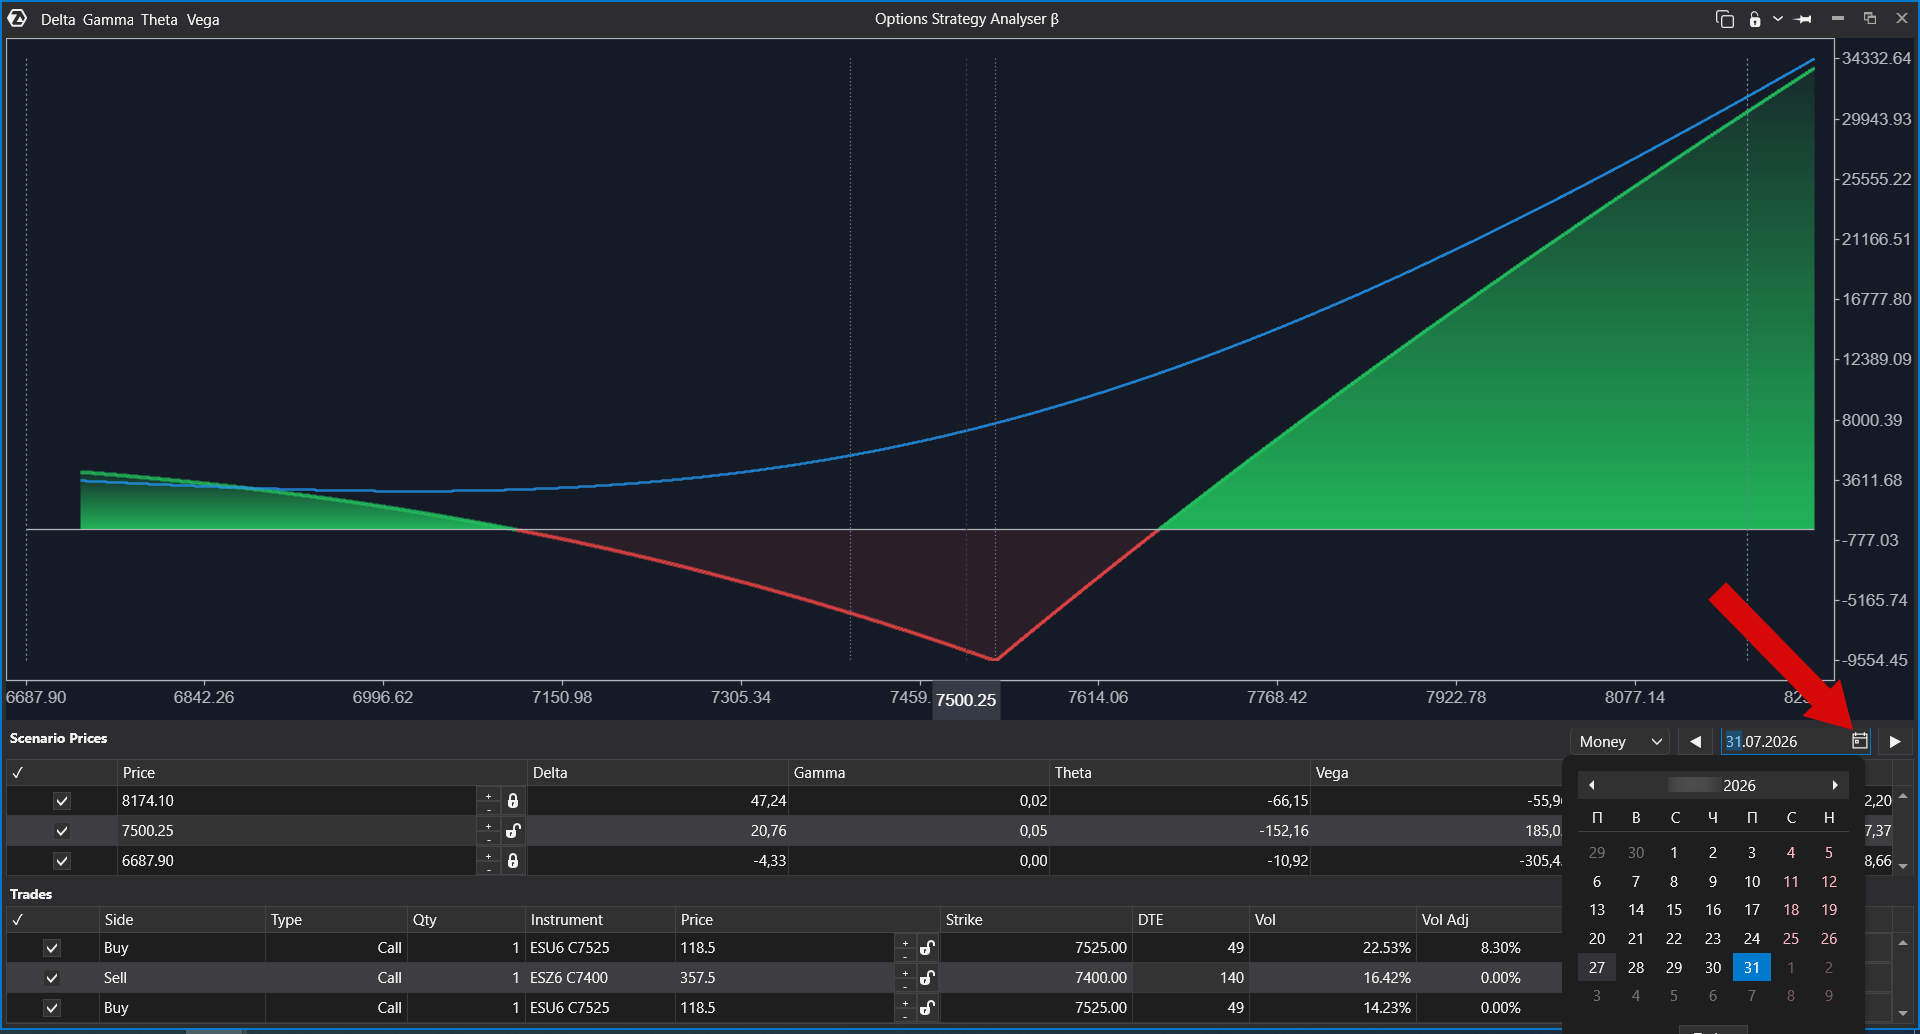
You can change the analysis date to model how the option value and strategy P&L may change over time. For example, you can estimate what may happen in several days if the underlying price and volatility stay the same.
The date can be selected from the date control or calendar.
How to use Scenario Prices
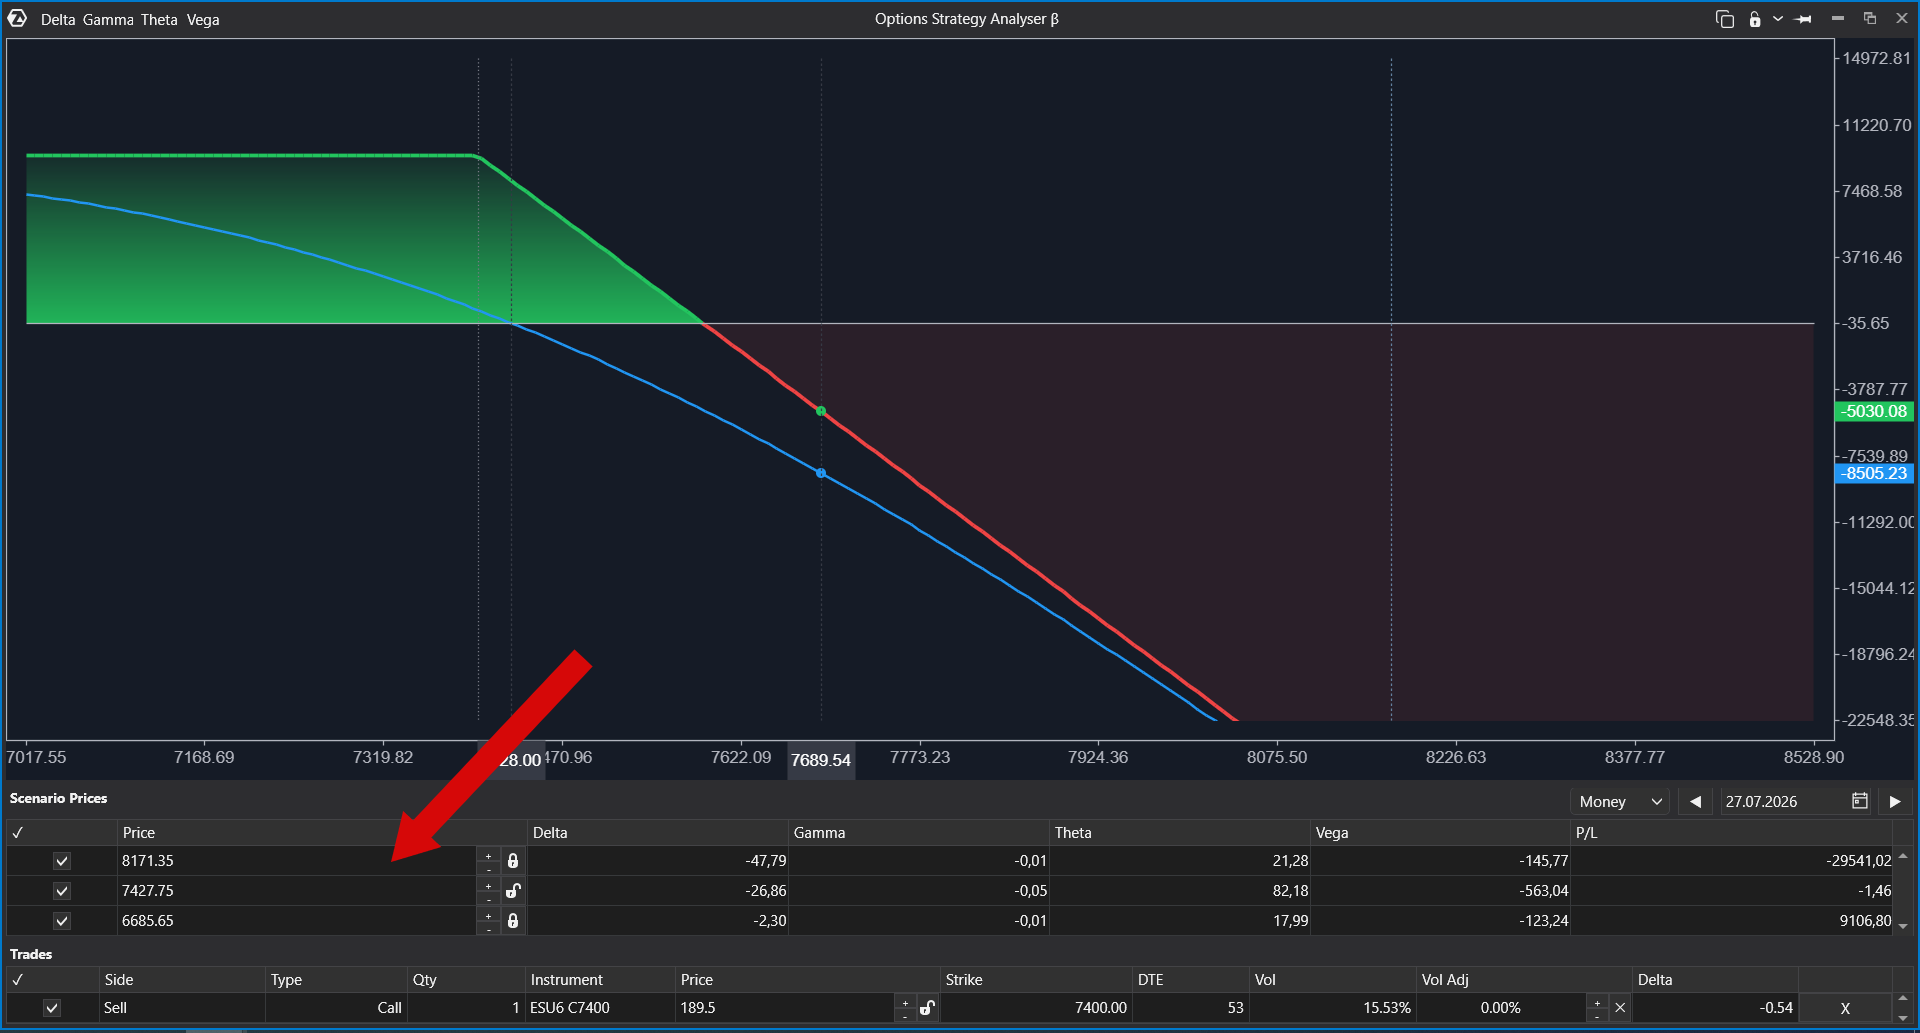
The Scenario Prices section lets you define specific underlying prices and review calculated values for each scenario.
By default, there are three scenario prices:
- middle row: current price;
- upper row: current price +10%;
- lower row: current price -10%.
For each scenario price, ATAS can calculate values such as Delta, Gamma, Theta, Vega, and Profit/Loss.
You can edit scenario prices in the interface or move them directly on the chart. If you manually edit an unlocked scenario price, it becomes locked and stops following the default dynamic value.
Money vs Points mode
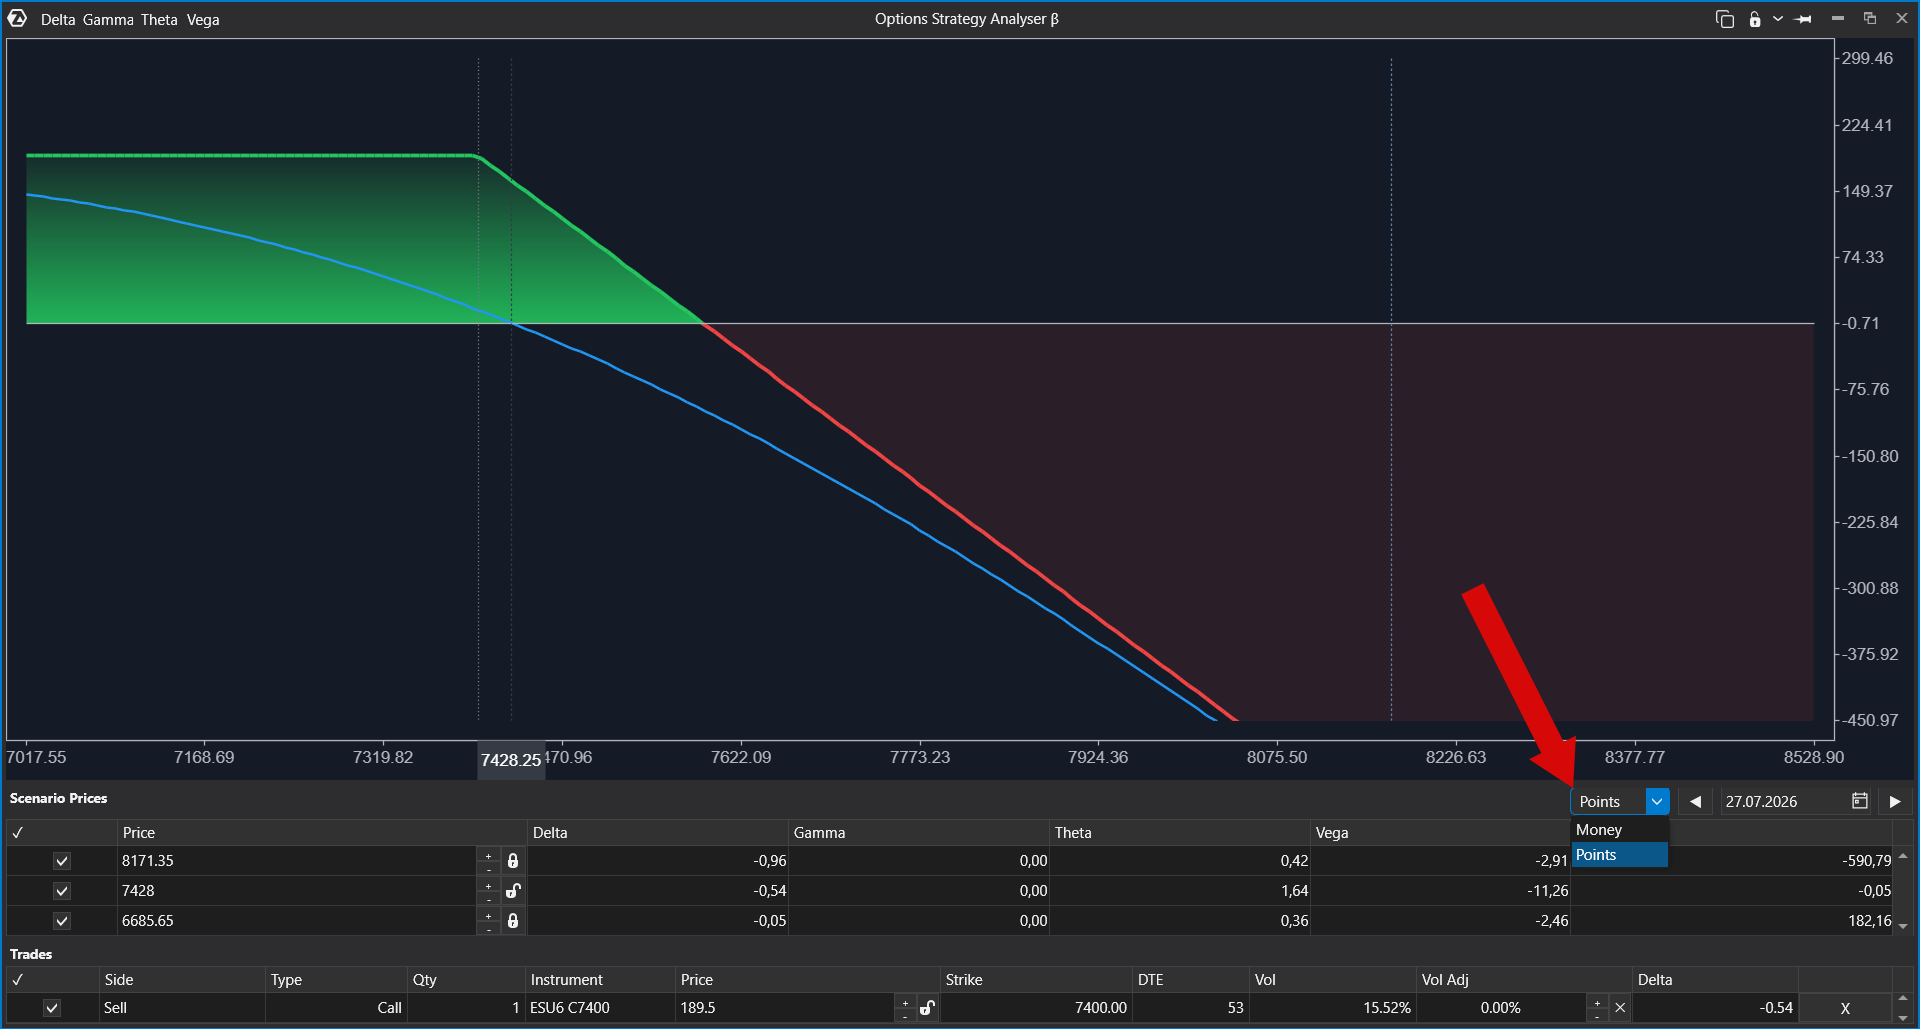
The module can display values in money or in points.
- Money mode shows the result as a monetary value.
- Points mode shows the result in units of underlying price movement.
Use the mode that is more convenient for your analysis and instrument type.
How to work with the chart
You can zoom the chart with the mouse wheel, move it left or right, and adjust the vertical or horizontal scale using the axes. When you hover over the chart or axis area, ATAS can show values for the displayed lines.
How to show Greeks on the chart
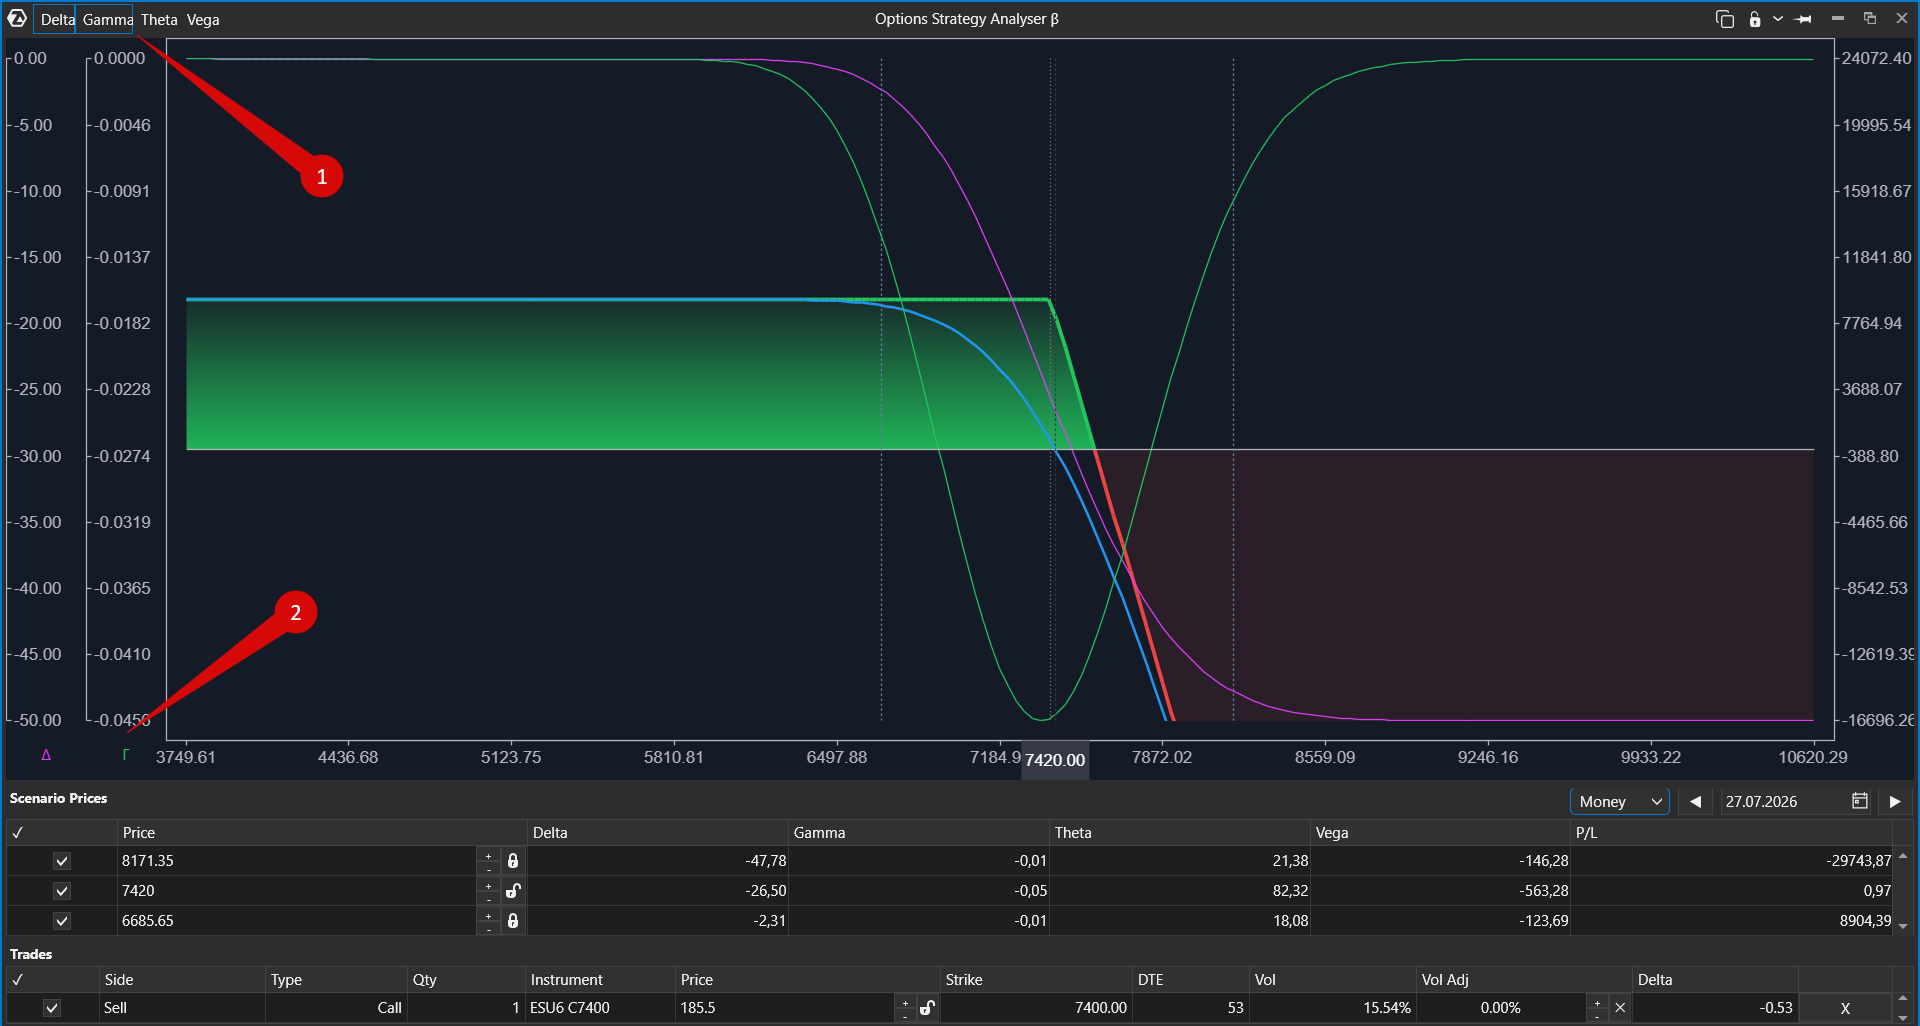
You can optionally display Greeks directly on the chart. This helps you see how a selected Greek may change at a specific underlying price.
Greek values can be displayed in money or points, depending on the selected mode.
Notes
Strategy Analysis is a modeling tool. Results depend on the selected option prices, volatility, date, scenario prices, and available market data. The values shown in the module are not trading recommendations.
Related articles
Was this article helpful?
That’s Great!
Thank you for your feedback
Sorry! We couldn't be helpful
Thank you for your feedback
Feedback sent
We appreciate your effort and will try to fix the article