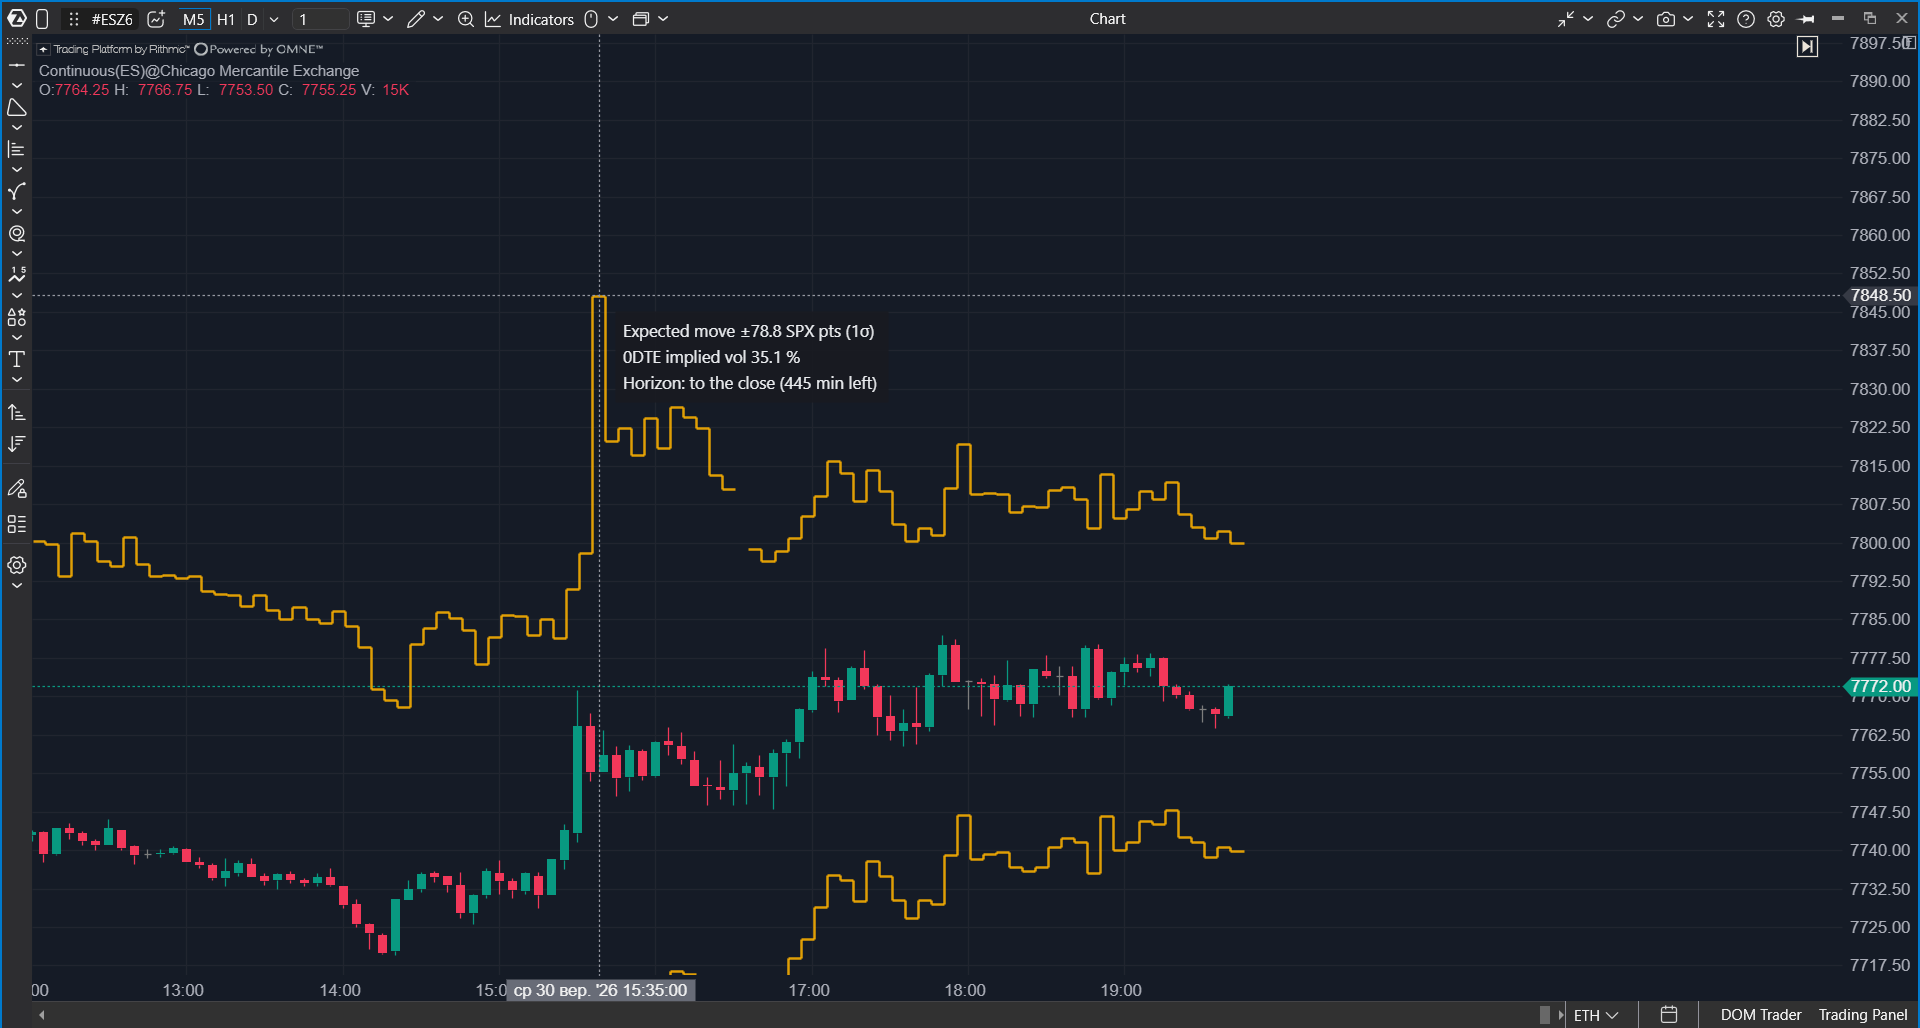
Options X-Ray: Expected Move draws a corridor on an ES, MES, SPY, or US 500 chart that shows how far, according to the options market, price may move before the selected options expire. The corridor is recalculated every minute, so you can see how market expectations change during the day.
 Why Use It
An option price depends on how much movement market participants expect. The larger the expected move, the more expensive the options. Using option prices, the indicator estimates what move has already been priced in until expiration and draws it directly on the chart.
The corridor helps answer these questions:
- What kind of day the market considered normal. While price stays inside the corridor, it is moving within what the options market expected.
- Where natural targets may be. Corridor boundaries often work as movement targets or areas where traders take profit.
- How unusual the day is. A move outside the boundary means price moved more than the market had priced in.
- Whether the market is nervous. Before important news, the corridor often widens. After the event, it can narrow. The width itself reflects market expectations.
Expected Move is not a trading signal. It shows the move priced into options, but it does not predict direction. A price near the boundary does not mean overbought or oversold. Confirm decisions with tape, clusters, delta, and price reaction.
What You Should Know Before You Start
| Chart | Use an ES, MES, SPY, or US 500 chart. ES and MES work with any specific contract, for example ESZ5. The corridor is calculated from OptionsDepth analytics derived from CBOE market data for S&P 500 index (SPX) options, and it is mapped to the chart automatically. |
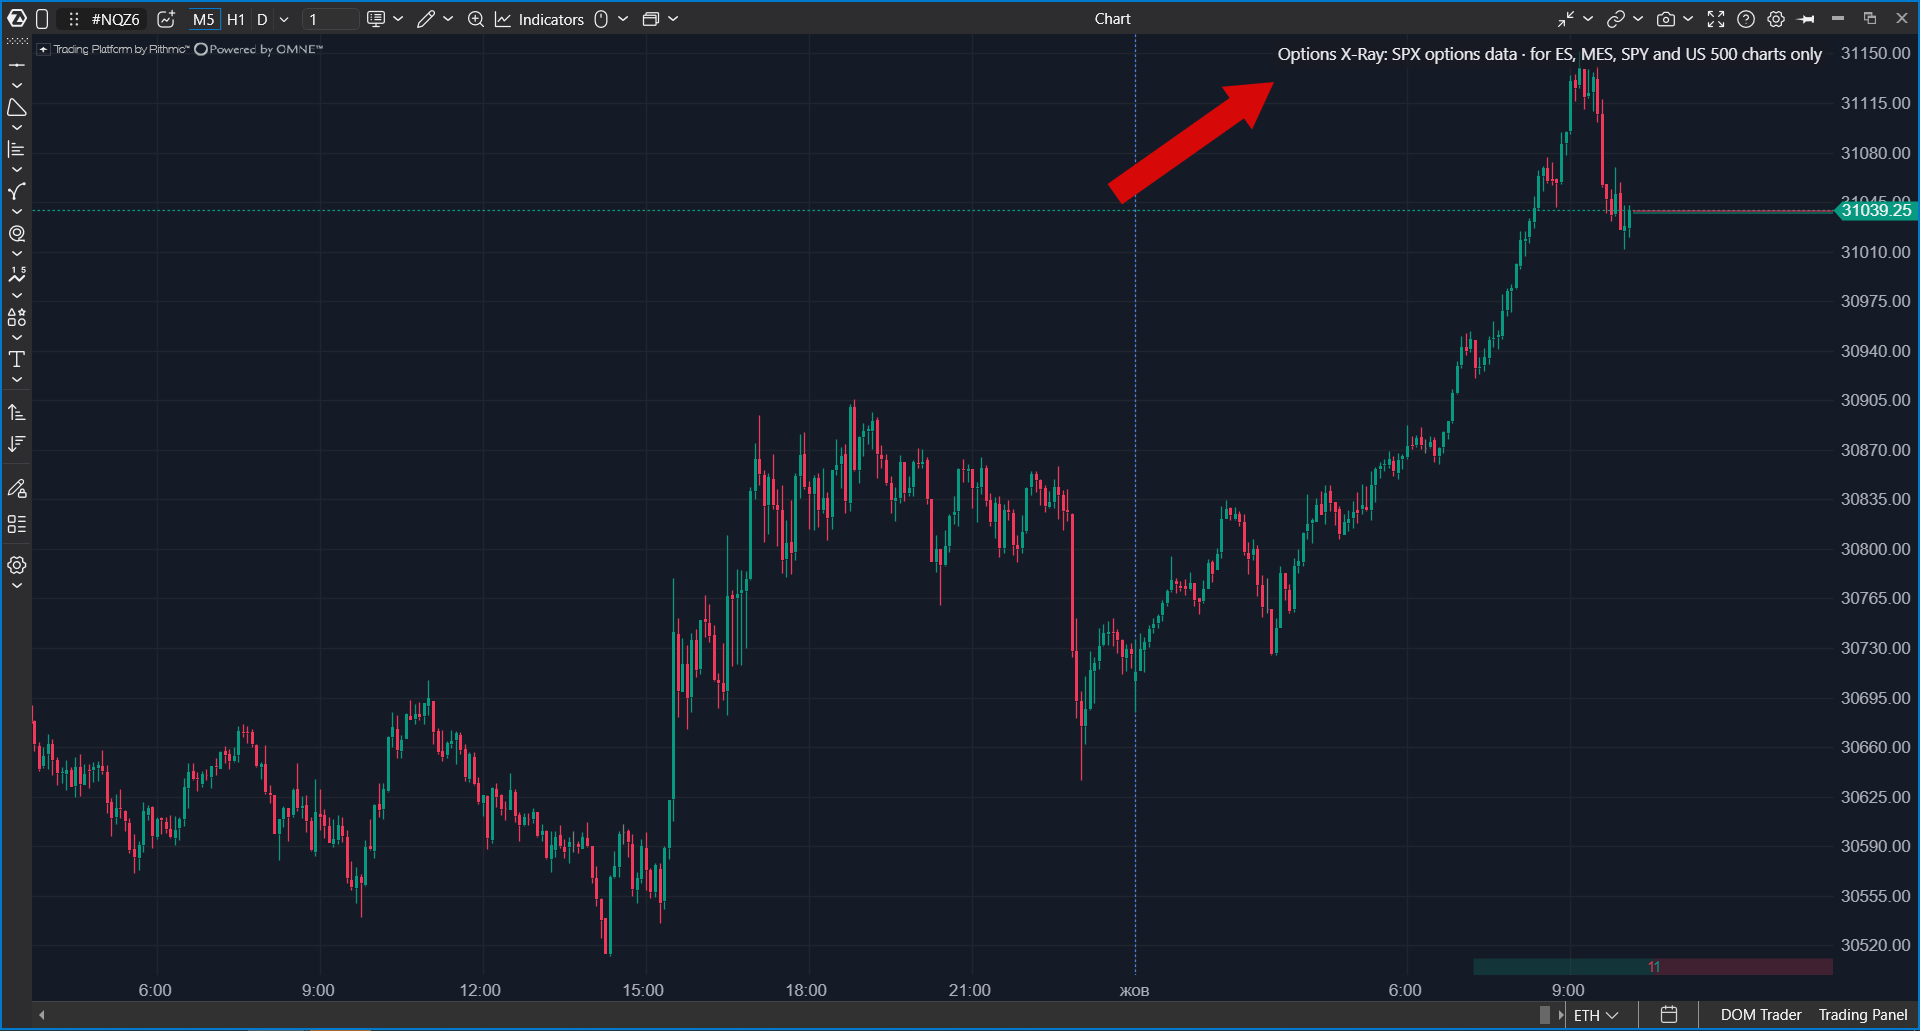
| Other markets | On any other instrument (NQ, oil, gold, individual stocks, crypto) the indicator draws nothing and shows an explanatory chip instead: Options X-Ray: SPX options data · for ES, MES, SPY and US 500 charts only. For CME futures, use the similar Expected Move indicator from the Options Chain set. |
| Update frequency | The corridor updates once per minute and is also drawn historically, so you can see how wide it was earlier in the day. |
| Expiration point | The corridor is calculated until the exact expiration time of the selected option series: for weekly and daily options, 16:00 New York time; for morning monthly options, 09:15; and on shortened holiday sessions, 13:00. |
| Access | Options X-Ray indicators are part of a separate package. If the indicator is not in the list, check whether the package is enabled in your account. |
| Data | Built on minute-level SPX options positioning analytics derived from CBOE market data. Data & analytics by OptionsDepth. |
How to Read the Corridor
The corridor width is set in sigmas. Sigma is a measure of how far price may deviate according to the market. The more sigmas you use, the wider the corridor and the less often price moves outside it.
| Corridor | Meaning |
| 1 sigma | According to the options market, price is expected to finish inside the corridor roughly two times out of three, about 68%. A move outside the boundary is a strong day. This is the default setting. |
| 2 sigmas | Price is expected to finish inside the corridor roughly 95% of the time. A move outside this boundary is rare and extreme; after such moves, pullbacks are common. |
These percentages are the options market's estimate, not a guarantee.
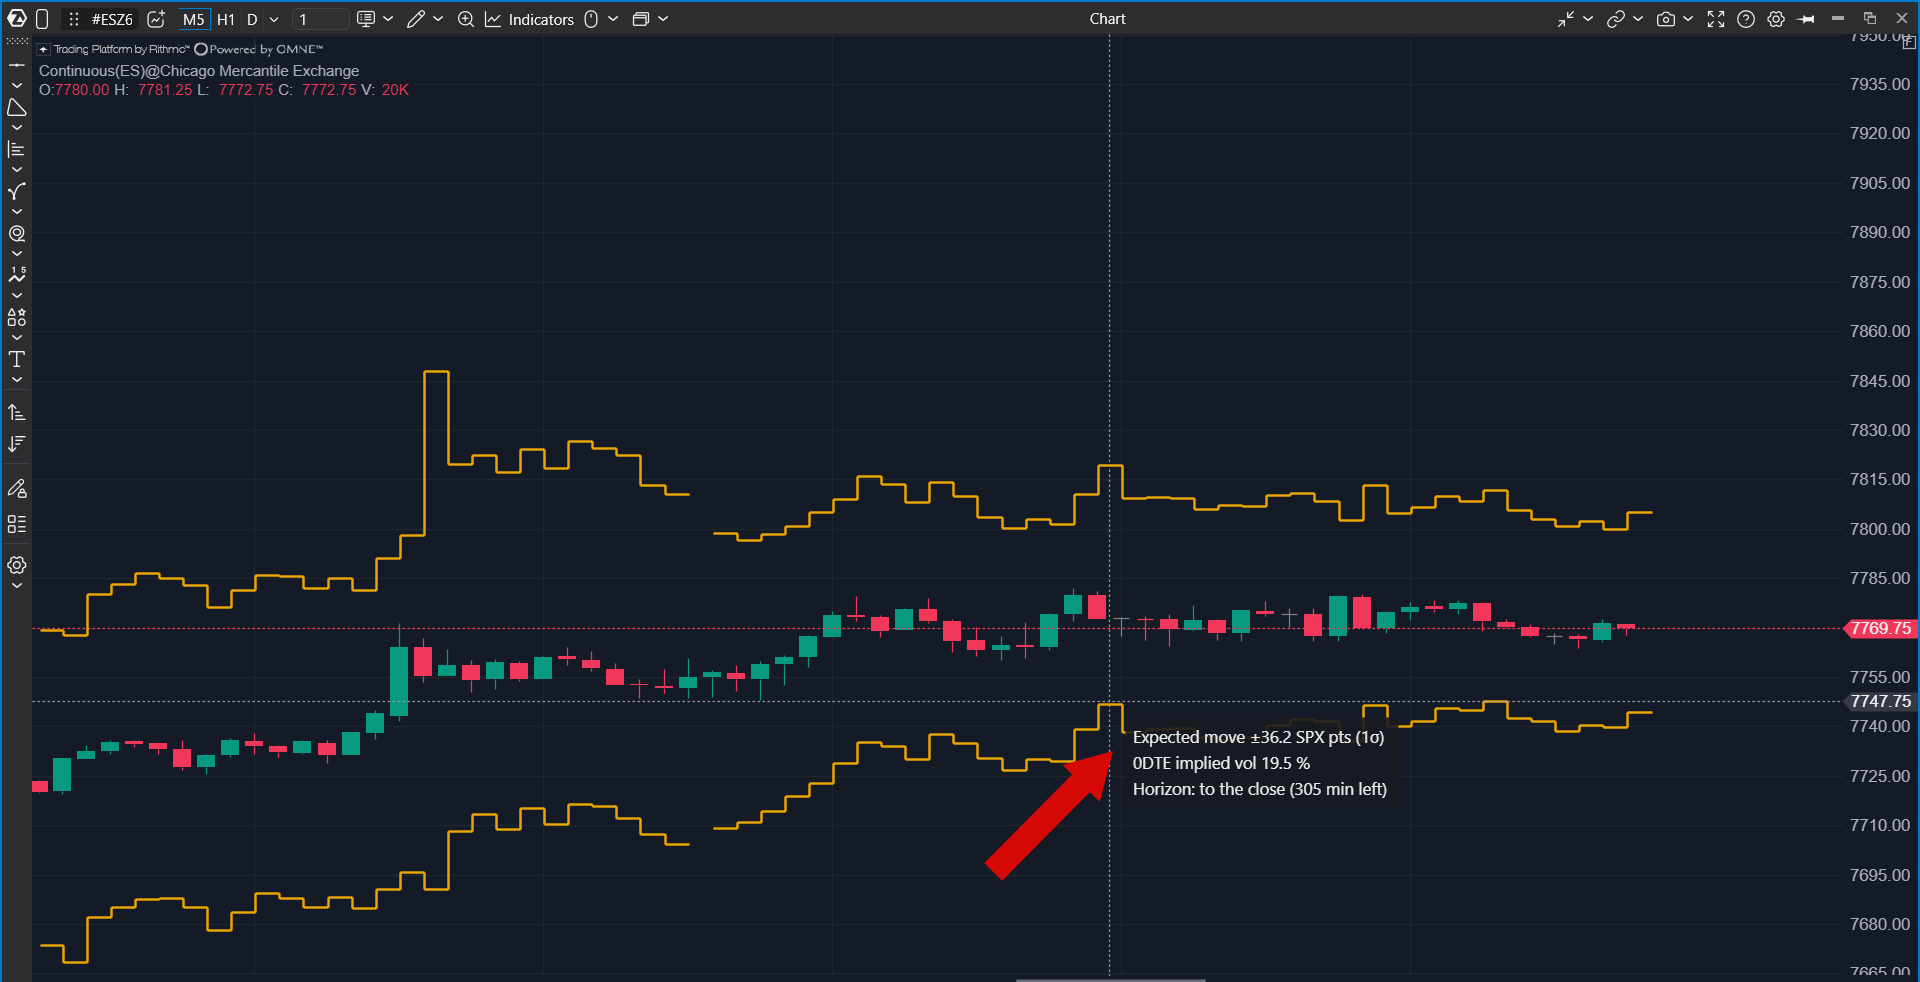
Tooltip Card
Hover over the corridor to open a card with values for the selected moment.
 Why the Corridor Narrows
For options that expire today, the corridor becomes narrower toward the evening and converges toward price at expiration. This is expected. The less time remains, the less time the market has to move, so the expected move decreases together with remaining time. The narrowing is not linear: it is slower in the morning and faster near the close.
The corridor can also narrow when the market calms down, for example right after important news has been released.
How to Add the Indicator
- Open an ES, MES, SPY, or US 500 chart.
- Click Indicators on the top panel.
- Select the Options Analytics group or type Options in search.
- Select Options X-Ray: Expected Move.
- Click Add to chart.
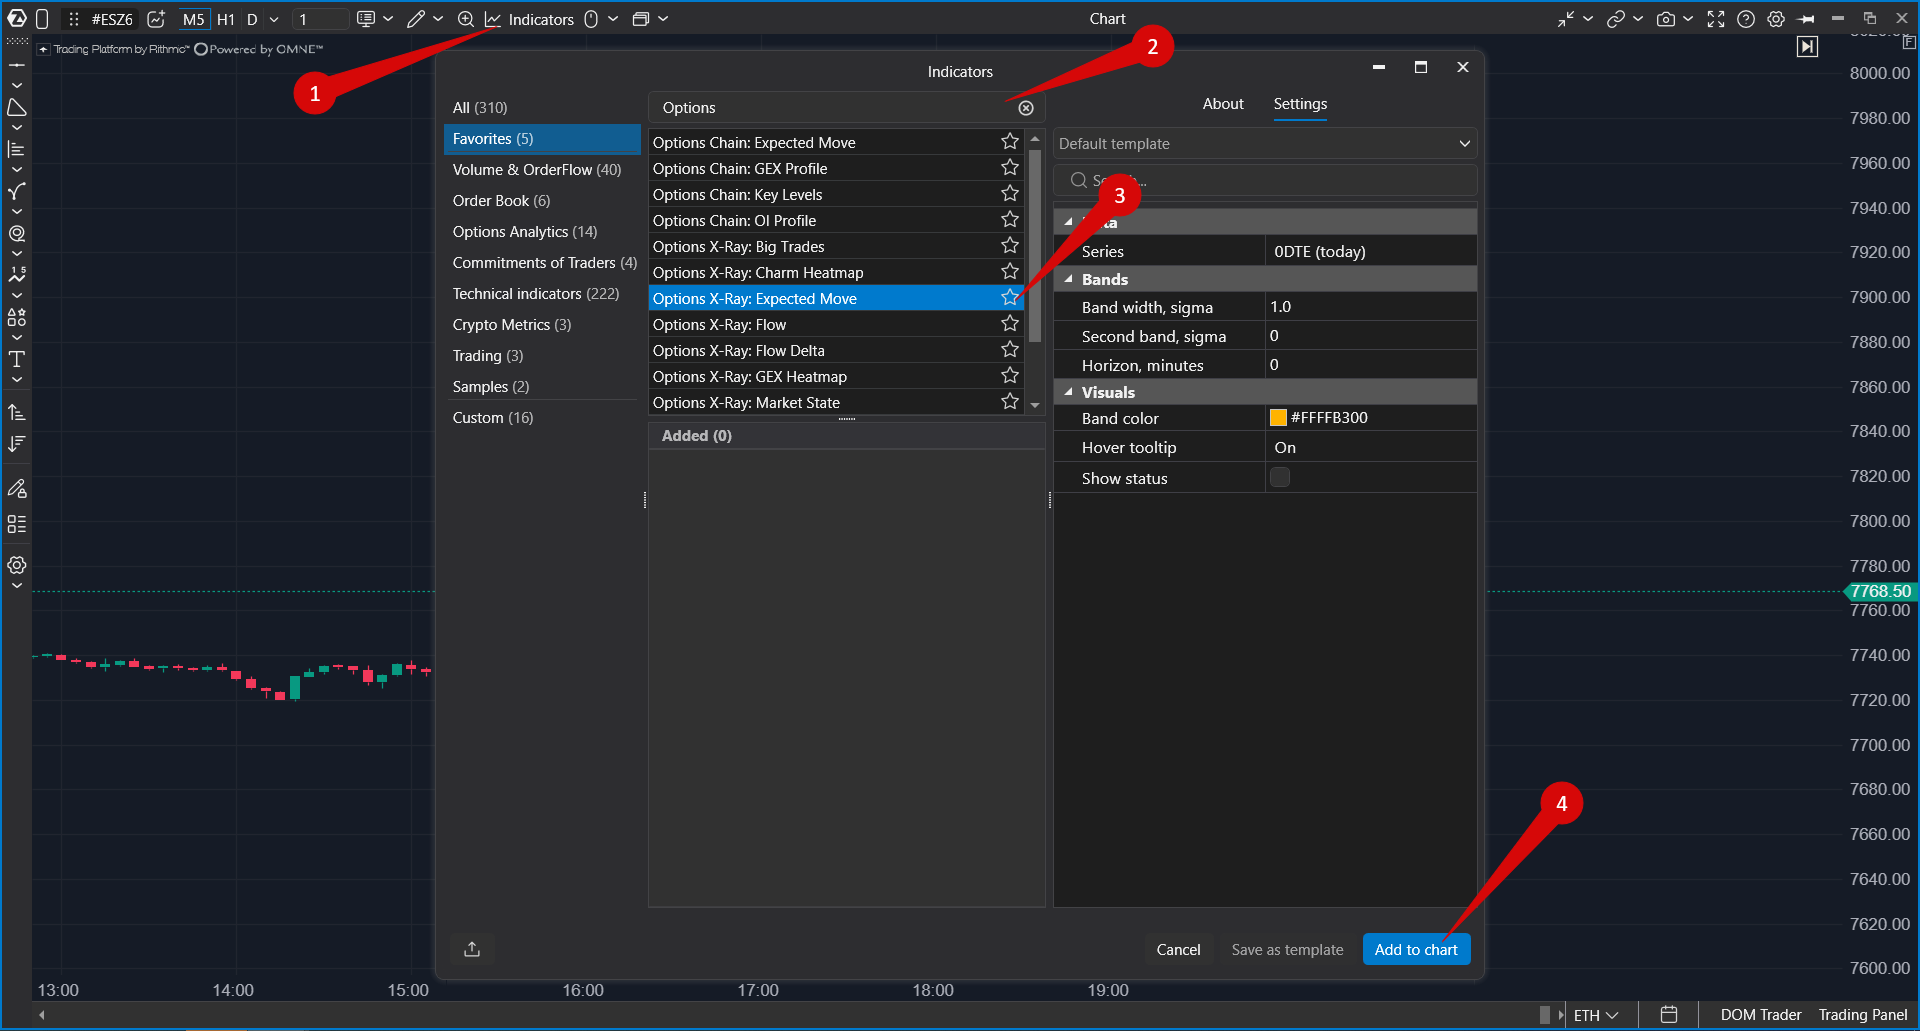 To change settings later, open Indicators again, select the indicator in the Added section, and click Apply.
Settings
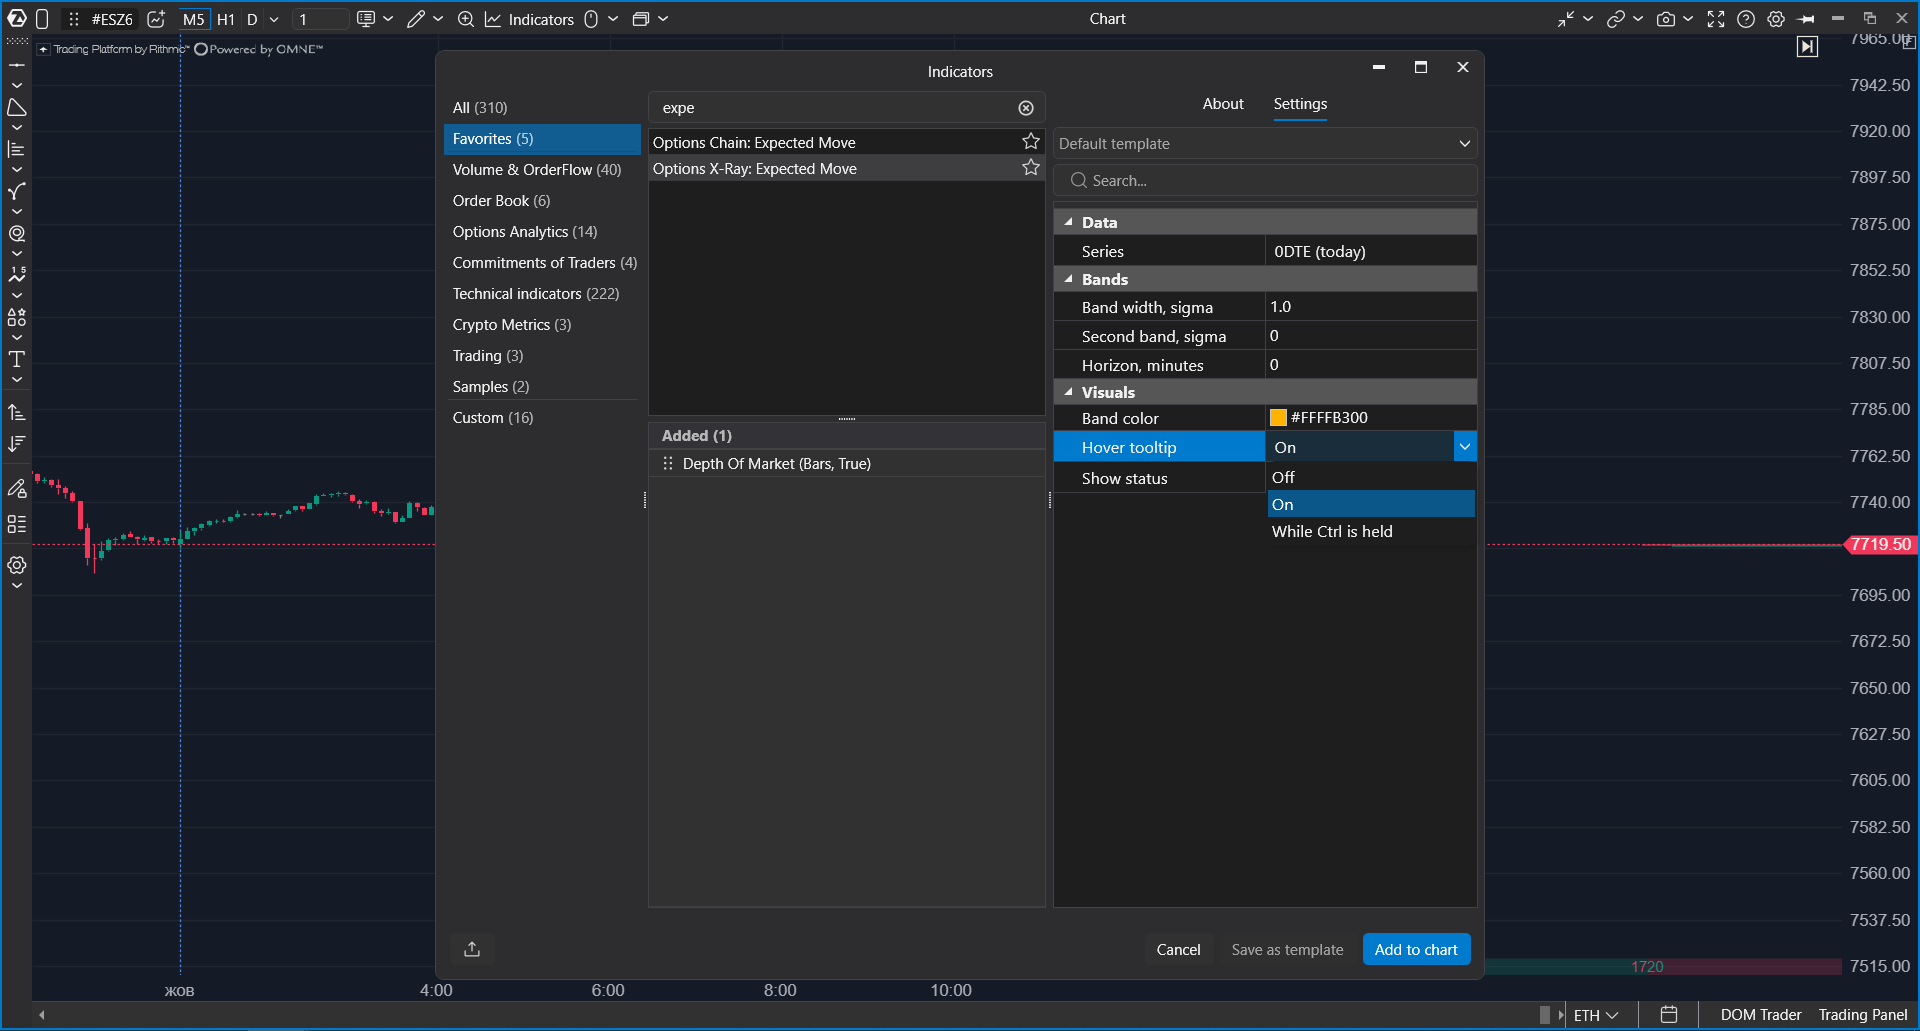
| Setting | What it does |
| Series | Selects which options are used to build the corridor. 0DTE (today) uses options expiring today and draws the corridor until today's close. This is the default. Next expiry uses the nearest next expiration. |
| Band width, sigma | Sets the width of the main corridor in sigmas. The default is 1.0. |
| Second band, sigma | Sets the width of the second corridor in sigmas. The default is 0, which means the second band is disabled. |
| Horizon, minutes | Sets the expected-move horizon. The default is 0, which means until the selected options expire. If you enter a number of minutes, the corridor shows the expected move that many minutes forward. |
| Band color | Controls the corridor boundary color. The default is amber. |
| Hover tooltip | Controls the hover card: Off, On (default), or While Ctrl is held. The Ctrl mode keeps the chart clean and shows the card only on demand. |
| Show status | Shows the indicator status line in the chart corner. It is disabled by default. |
Difference From Options Chain: Expected Move
ATAS has two Expected Move indicators. They measure the same concept, but they use different data sources.
| Options X-Ray: Expected Move | Options Chain: Expected Move | |
| Data | CBOE-derived SPX options analytics by OptionsDepth. No separate data connection is needed. | Option quotes from your connection, such as Interactive Brokers or Rithmic. |
| Instruments | ES, MES, SPY, and US 500. | ES, NQ, CL, GC, and other CME futures. |
| Update | Once per minute, with history. | Calculated from current option quotes and drawn as one corridor from the current bar to the right. Earlier values are not shown. |
| When to use | When trading ES, MES, SPY, or US 500 and you want to see how expectations changed during the day. | When trading another futures market or when you do not have the Options X-Ray package. |
How to Work With the Indicator
- At the start of the day, check the corridor width. A wide corridor means the market expects stronger movement. A narrow corridor suggests a calmer day.
- Check where price is now: near the middle or already near a boundary.
- Watch the width before important news. Expansion means the market is pricing in uncertainty.
- Near a boundary, do not automatically trade against the move. The boundary is context, not a reversal signal.
- If price moves outside the 1-sigma band, treat the day as unusual and adjust targets and position size accordingly.
Troubleshooting
| What happens | What to do |
| The indicator is not in the list | Check whether the Options X-Ray package is enabled in your account. |
| The corridor is not drawn, and the chart shows the chip "Options X-Ray: SPX options data · for ES, MES, SPY and US 500 charts only" | The chart instrument is not supported. Open an ES, MES, SPY, or US 500 chart. |
| The corridor is not drawn on a supported chart | During weekends and holidays there is no new data, but previous sessions should still be displayed. |
| The corridor narrows toward the evening | This is expected. Less time remains until expiration. |
| The corridor changed sharply on Friday morning | If it is the third Friday of the month, monthly options may have expired in the morning and the indicator switched to weekly options. This is expected. |
| Levels look inaccurate, and the status mentions calibration | The chart does not have enough history to map index levels to the chart accurately. Load more days on the chart. Enable Show status if you want to see the status line. |
| The corridor differs from Options Chain: Expected Move or another service | Indicators and services use different data sources and update times, so differences are normal. |
Was this article helpful?
That’s Great!
Thank you for your feedback
Sorry! We couldn't be helpful
Thank you for your feedback
Feedback sent
We appreciate your effort and will try to fix the article