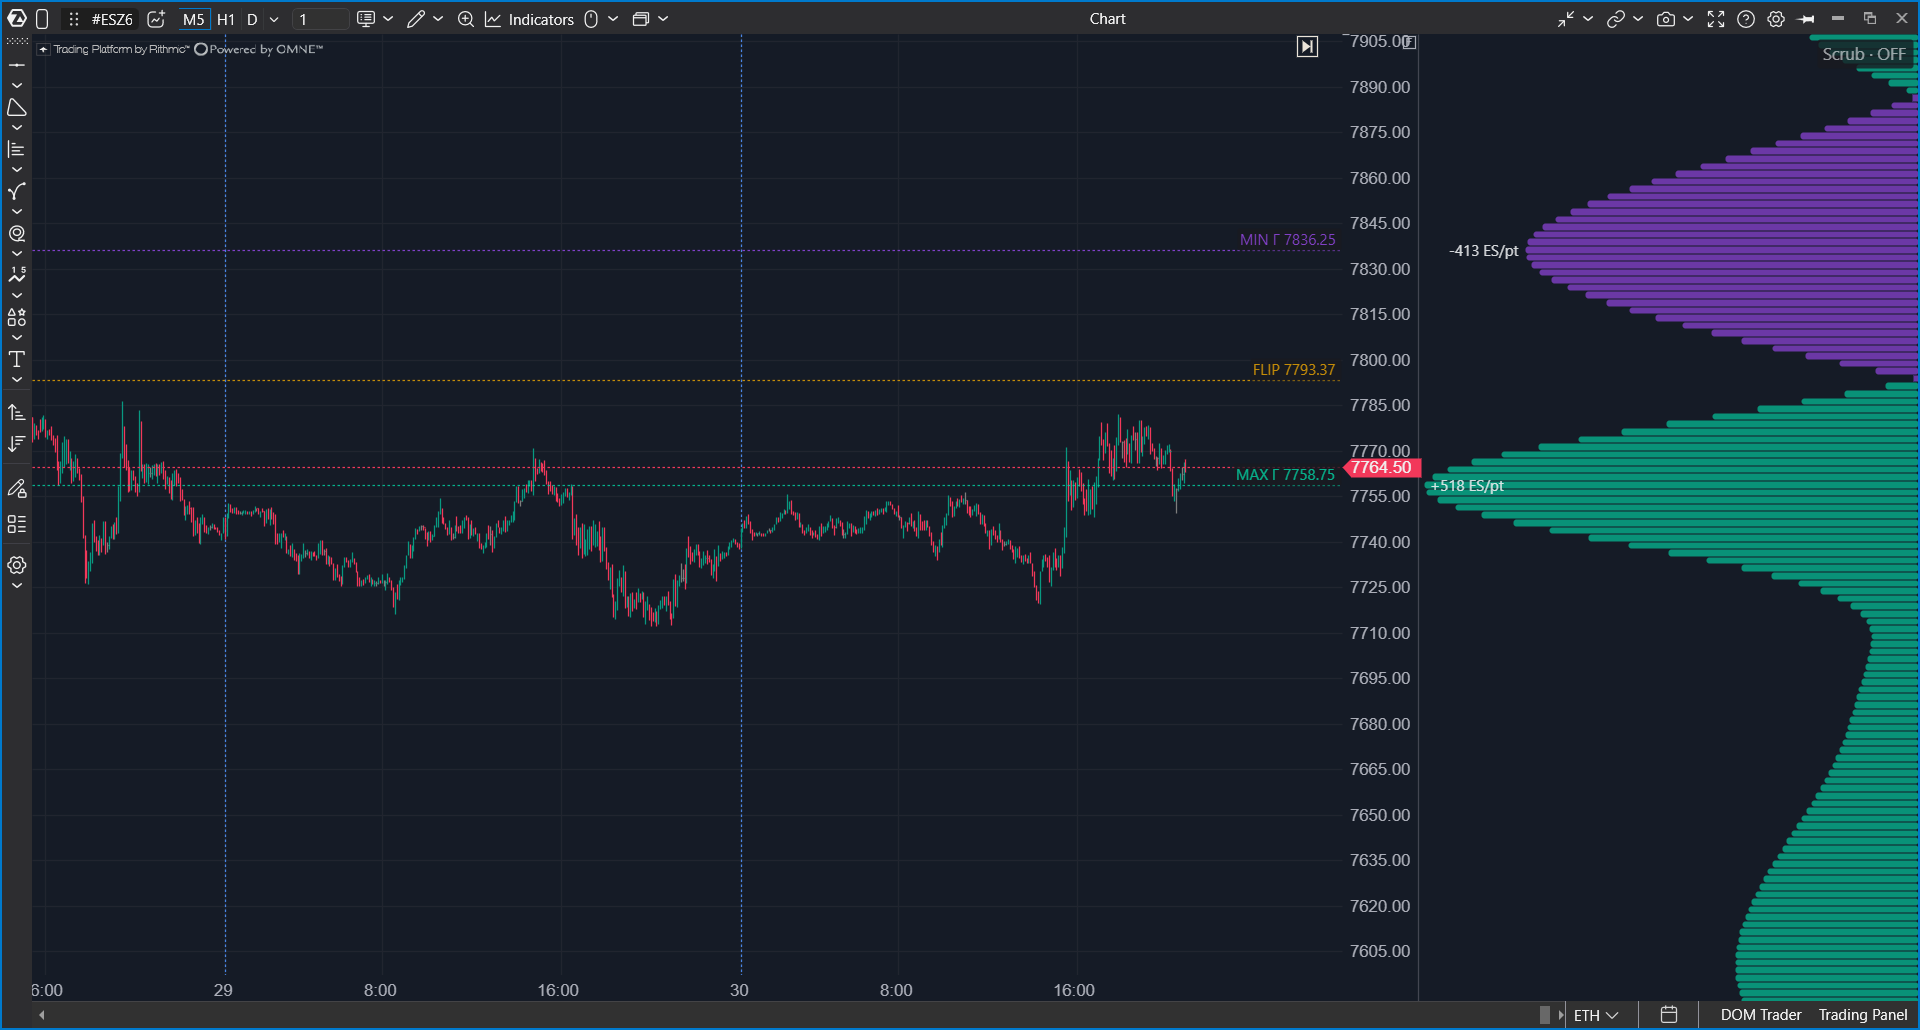
Options X-Ray: Surface Profile shows at the edge of an ES, MES, SPY, or US 500 chart how strongly market makers may affect price at each level, using numeric profile bars. It is a slice of GEX Heatmap and Charm Heatmap at the selected moment, expanded into a histogram. In addition to gamma and charm, the profile can also show vanna, which does not have a separate heatmap in the Options X-Ray set.
On a heatmap, strength is visible only through brightness, which can be hard to estimate by eye. Surface Profile shows the same type of information with bar length and labels.
 Why Use It
Market makers hold ES futures against bought and sold options and must adjust those futures when price, volatility, or time changes. Surface Profile shows this at each price level. For gamma, it shows how many ES contracts market makers may need to buy or sell per point of price movement. For charm, it shows the total expected buying or selling caused by the passage of time.
The profile helps answer questions such as:
- How strong is the wall visible on GEX Heatmap, measured in ES contracts?
- Is it easier for price to move up or down today?
- How many ES contracts may market makers need to buy or sell at this level because of time decay?
- What may the picture look like one hour from now if market positions do not change?
Surface Profile is not a trading signal. It is a calculated estimate of how market makers may trade based on current positions. Confirm entries with tape, clusters, and delta.
What You Should Know Before You Start
| Chart | Use an ES, MES, SPY, or US 500 chart. ES and MES work with any specific contract, for example ESZ5. The data is OptionsDepth analytics derived from CBOE market data for S&P 500 index (SPX) options, and it is mapped to the chart automatically. |
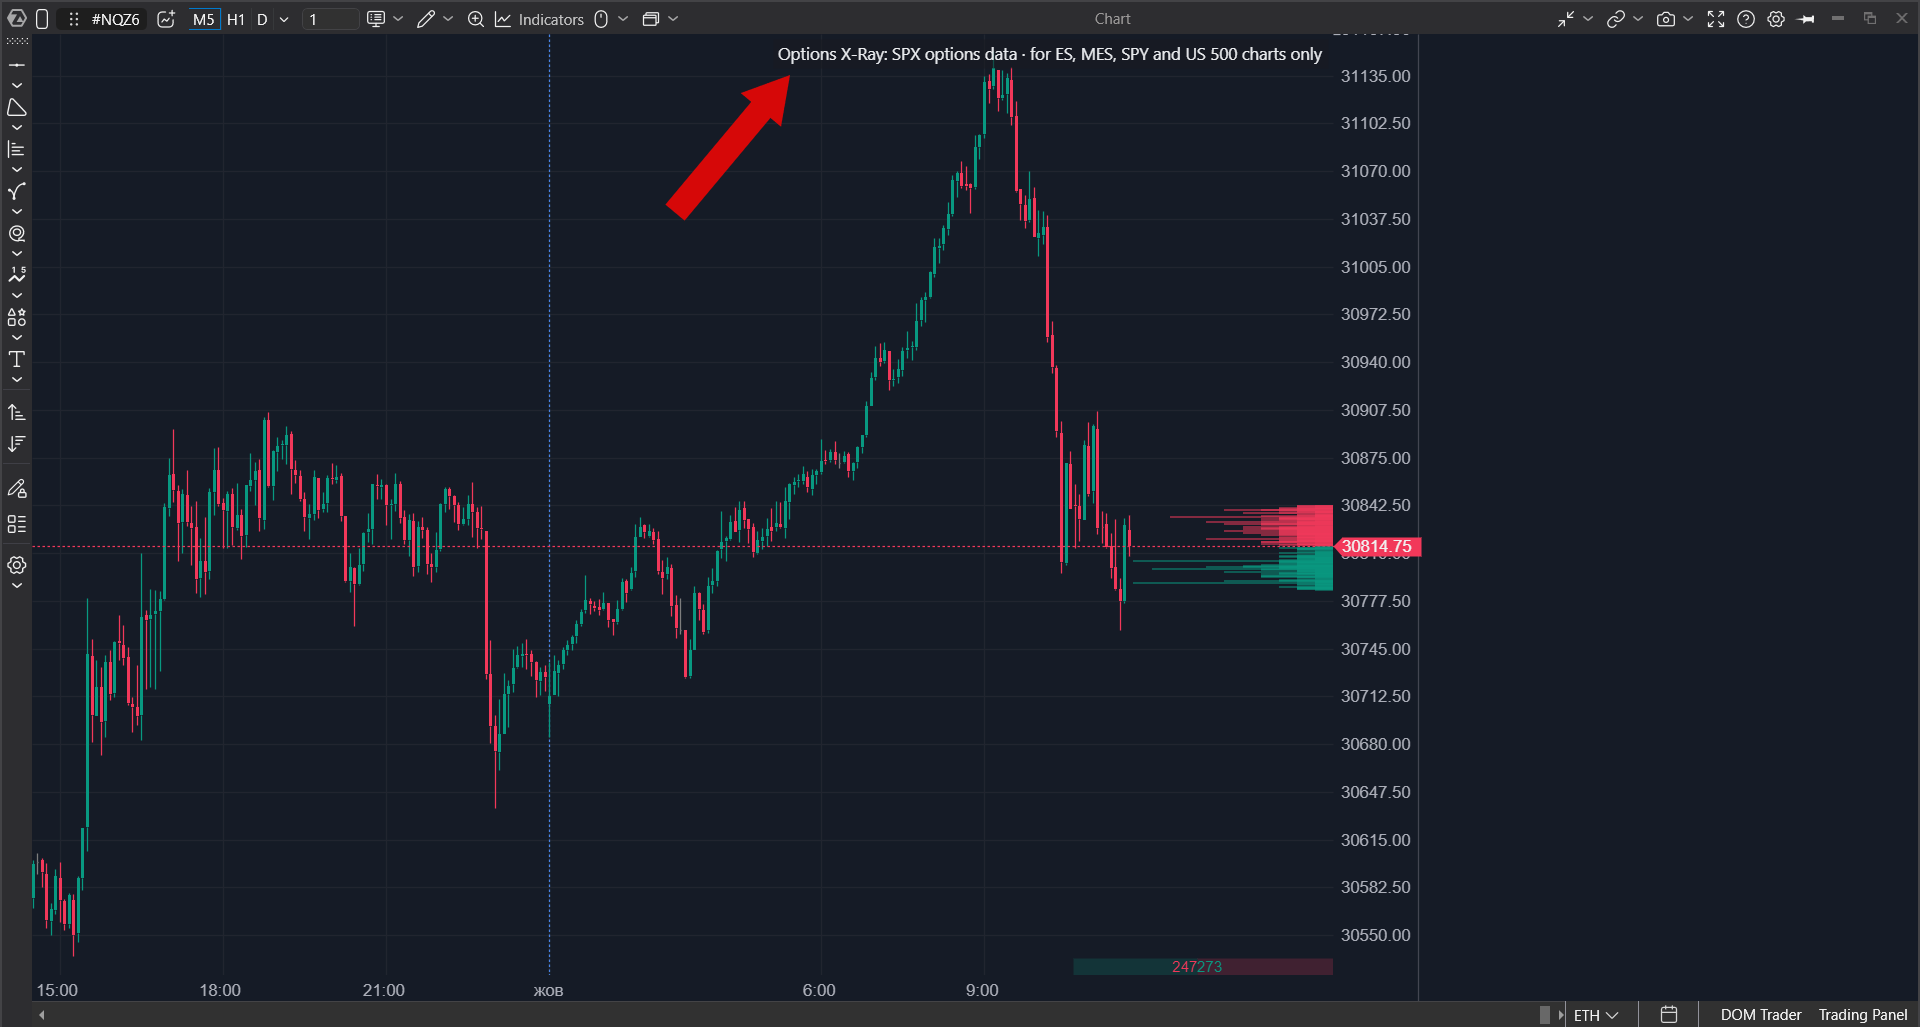
| Other markets | On any other instrument (NQ, oil, gold, individual stocks, crypto) the indicator draws nothing and shows an explanatory chip instead: Options X-Ray: SPX options data · for ES, MES, SPY and US 500 charts only. |
| Update frequency | The data updates once per minute. |
| Units | Values are shown in ES contracts. For gamma, the value is per point of price movement. |
| Expirations | Expirations cannot be selected. The profile is calculated using all options together. |
| Access | Options X-Ray indicators are part of a separate package. If the indicator is not in the list, check whether the package is enabled in your account. |
| Data | Built on minute-level SPX options positioning analytics derived from CBOE market data. Data & analytics by OptionsDepth. |
Difference from Strike Profile: Strike Profile breaks positions and forces down by strikes and selected expirations. Surface Profile shows force at any price level using all options together and can project forward. They are useful side by side.
How to Read the Profile
Each bar is a price level. Bar length shows strength, and color shows direction. The Surface setting selects what the profile shows.
| Surface | What it shows | Label at strong levels |
| Gamma (GEX) — MM | Where market-maker hedging may damp or amplify price movement. This is the default. | About N ES per point of movement. |
| Vanna (VEX) — MM | Where market makers may need to trade futures if volatility changes. | No special label. |
| Charm (CEX) — MM | Where market makers may need to buy or sell futures because time passes. | sell N ES or buy N ES. |
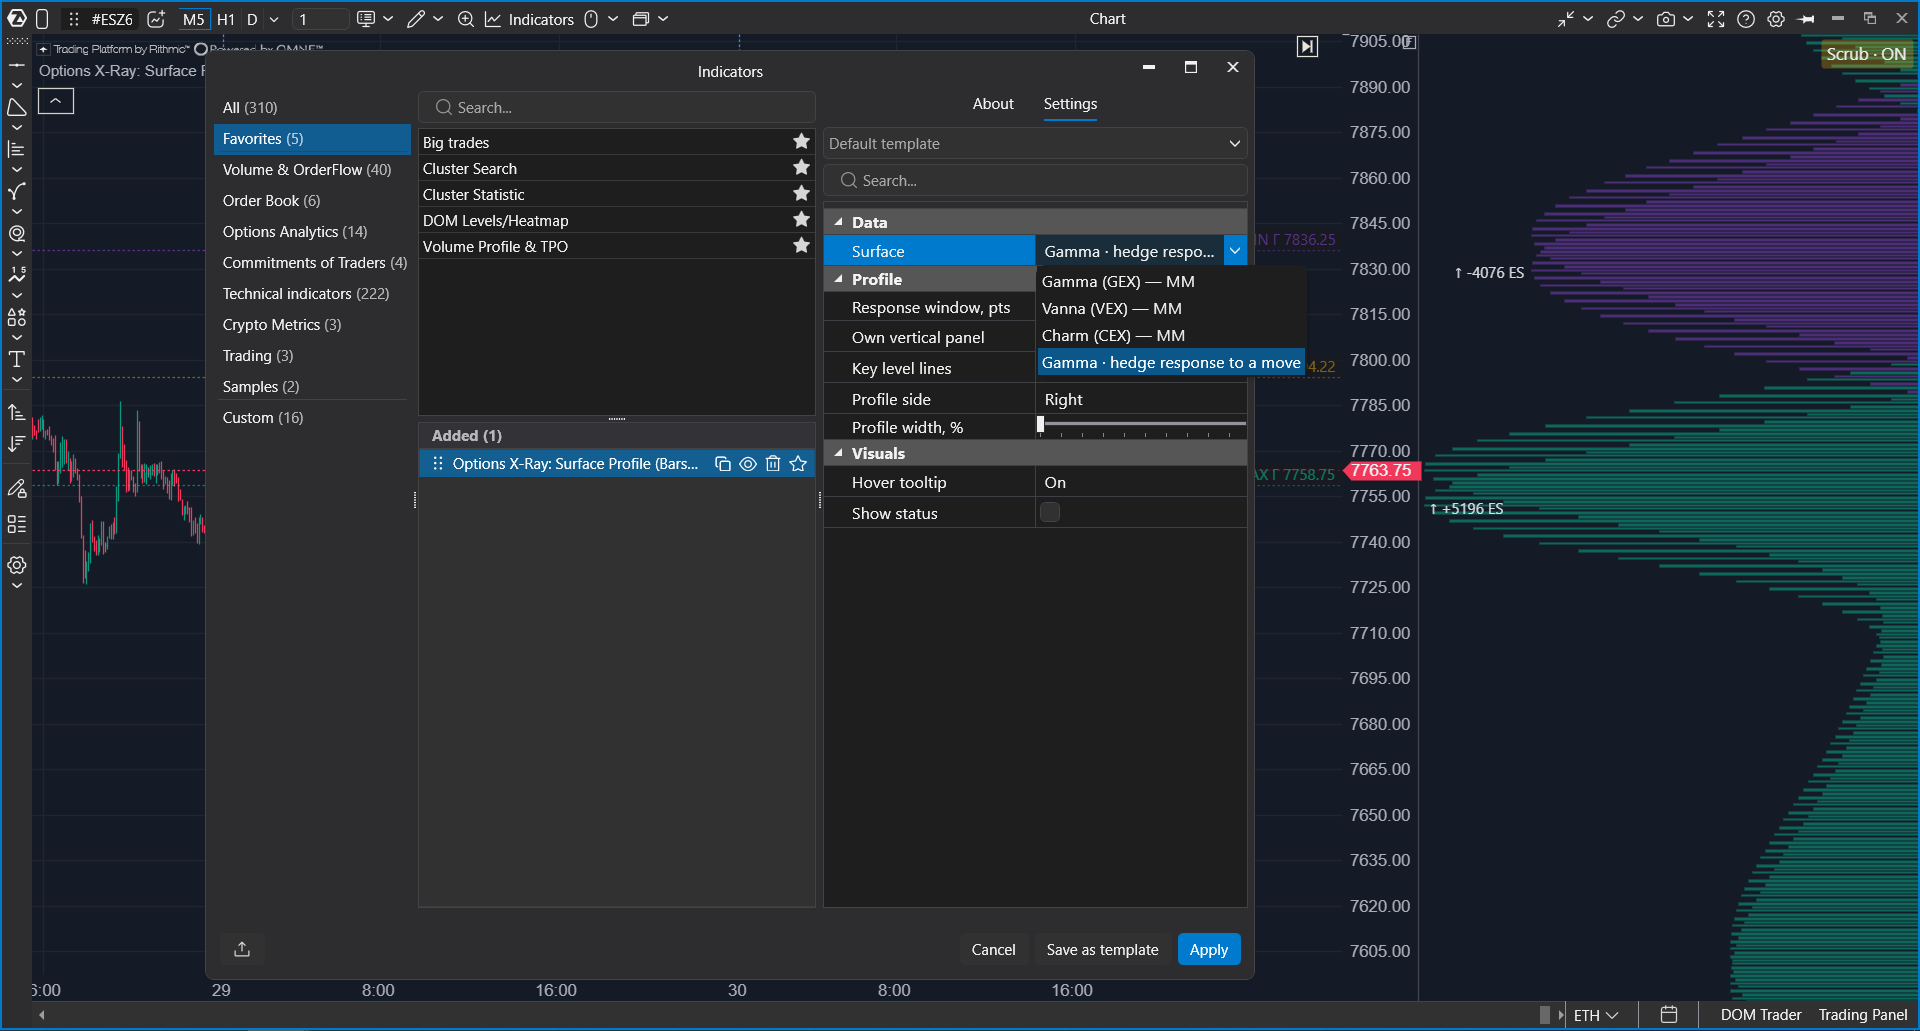
| Gamma: hedge response to a move | Hedge response to a move over a selected distance. | No special label. |
By default, the chart shows key level lines. You can disable them with Key level lines.
Hedge Response to a Move
The regular gamma profile answers this question: how strong is market-maker hedging at this exact level? The Gamma: hedge response to a move mode answers a different question: how much market makers may need to trade if price moves away from this level by several points.
| Mode | Question |
| Regular gamma | What force stands exactly at this level? |
| Hedge response to a move | How much force accumulates along the path if price moves up or down from here by the selected number of points? |
In this mode, each row is split into two halves. The upper half shows the response to an upward move, and the lower half shows the response to a downward move. Color still shows whether market makers damp or amplify the movement.
Compare the two halves. A long damping half above and a short half below means price may become sticky on the way up and move more freely downward. This directly answers which direction may be easier for price today.
The distance is controlled by Response window, pts. The default is 10 points, and the minimum is 4. The minimum exists because levels are calculated in 2.5-point price steps.
This mode is available only for gamma. Gamma responds to price movement, so adding it along a price path makes sense. Vanna and charm depend on volatility and time, so a price path is not the right context for them.
 Profile for Any Moment
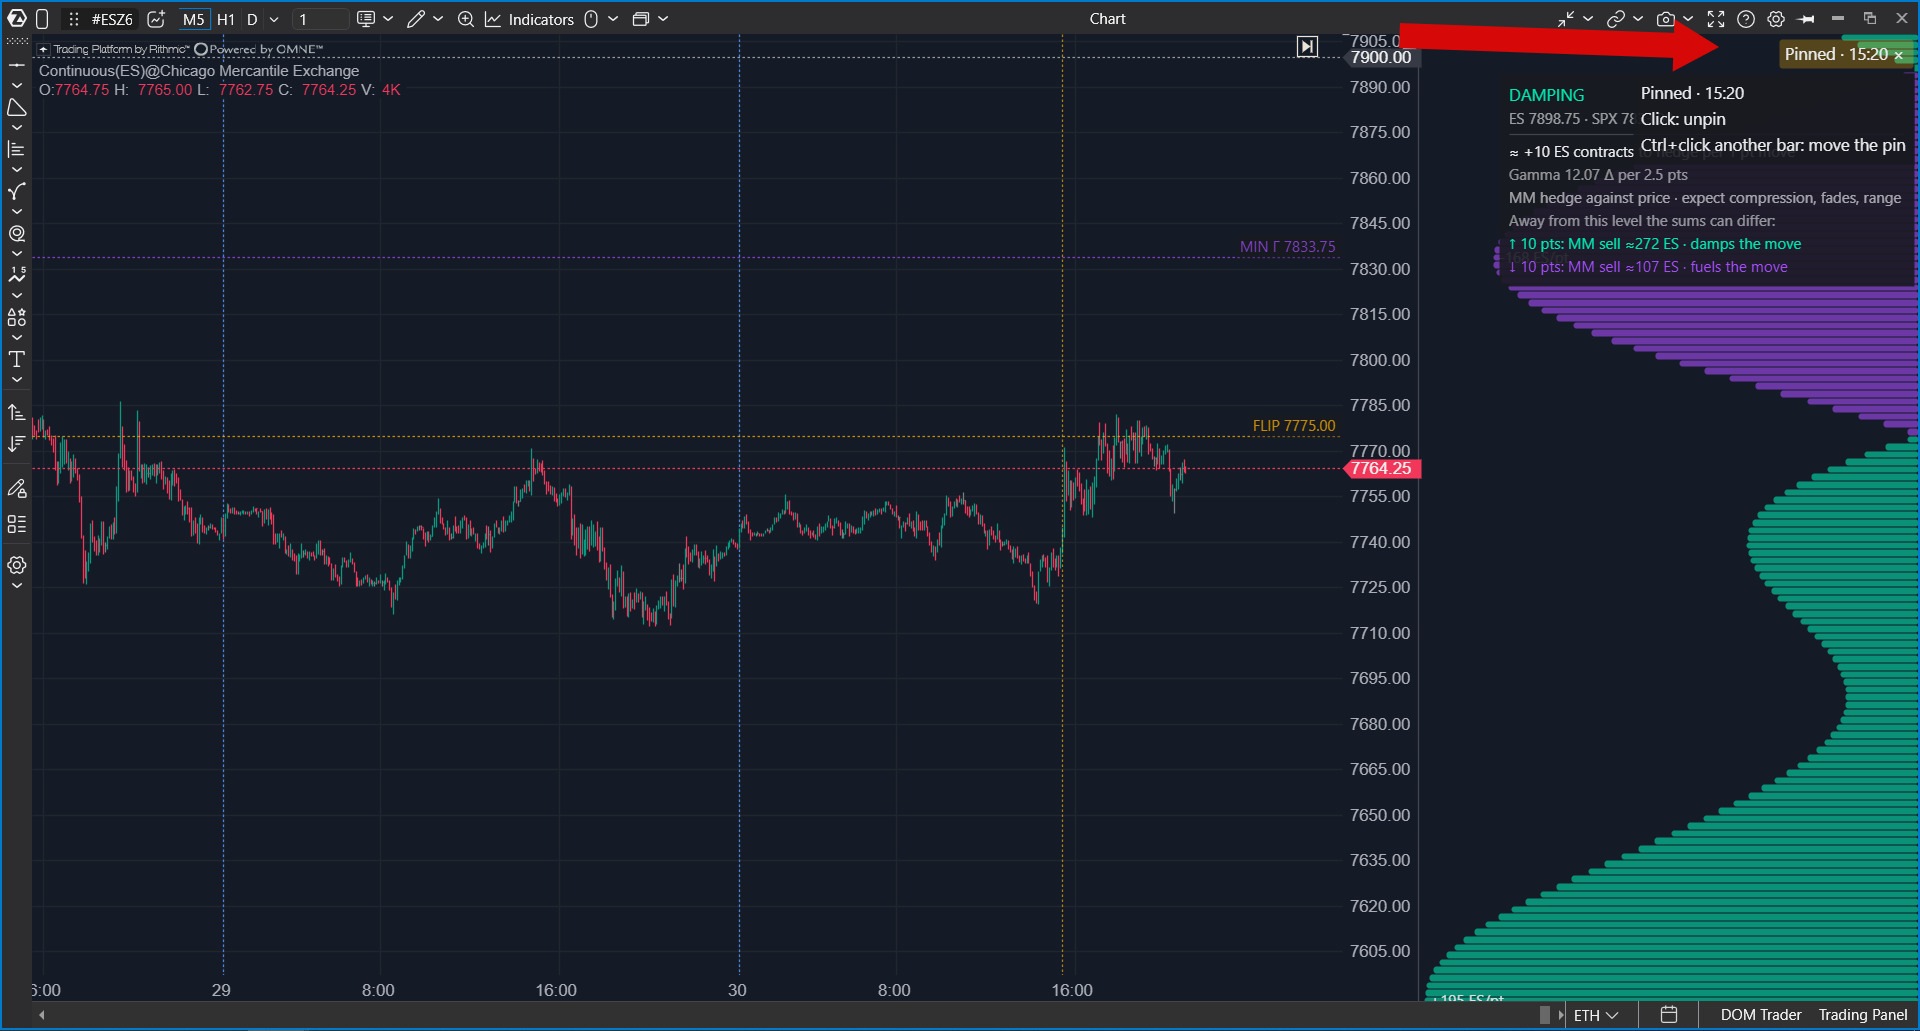
You can view the profile for any bar, including future time to the right of the last candle.
| Mode | How to enable it | What happens |
| Under cursor | Move the cursor across the chart. | The profile switches to the bar under the cursor. |
| Last bar | Click the label on the profile. | The profile shows the current candle. |
| Pinned bar | Ctrl + click a bar. | The profile is fixed on that bar. A dashed marker appears on the bar, and the label changes to a pinned state. Ctrl + click another bar to move the pin; click the label to remove it. |
If you move the cursor to the right of the last candle, the bars become lighter and the card shows FORECAST not observed. This is a projection based on current positions: what may happen if they do not change.
Enable Own vertical panel to move the profile into a separate panel next to the candles. The price scale remains shared. This is useful when you want to place Strike Profile and Surface Profile side by side: positions and forces by strike next to force at every price level.
Tooltip Card
Hover over a bar to open a level card.
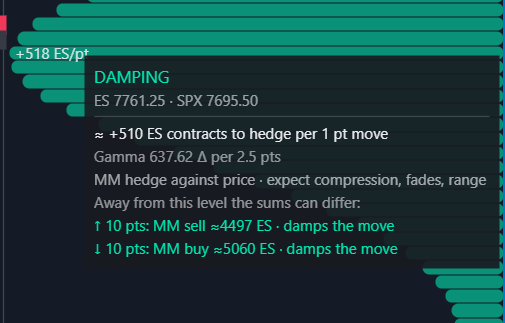
| Card part | What it shows |
| DAMPING / AMPLIFYING | For gamma: whether market makers damp or amplify movement at this level. |
| SELL PRESSURE AHEAD / BUY PRESSURE AHEAD | For charm: whether the passage of time may force market makers to sell or buy. |
| Strength at the level | For gamma, the number of ES contracts per point of price movement. For charm, the total number of ES contracts, shown as MM must BUY/SELL ≈ N ES contracts here. |
| Response up and down | A separate block in regular gamma mode showing how much response accumulates if price moves up or down. This lets you see level asymmetry without switching modes. |
How to Add the Indicator
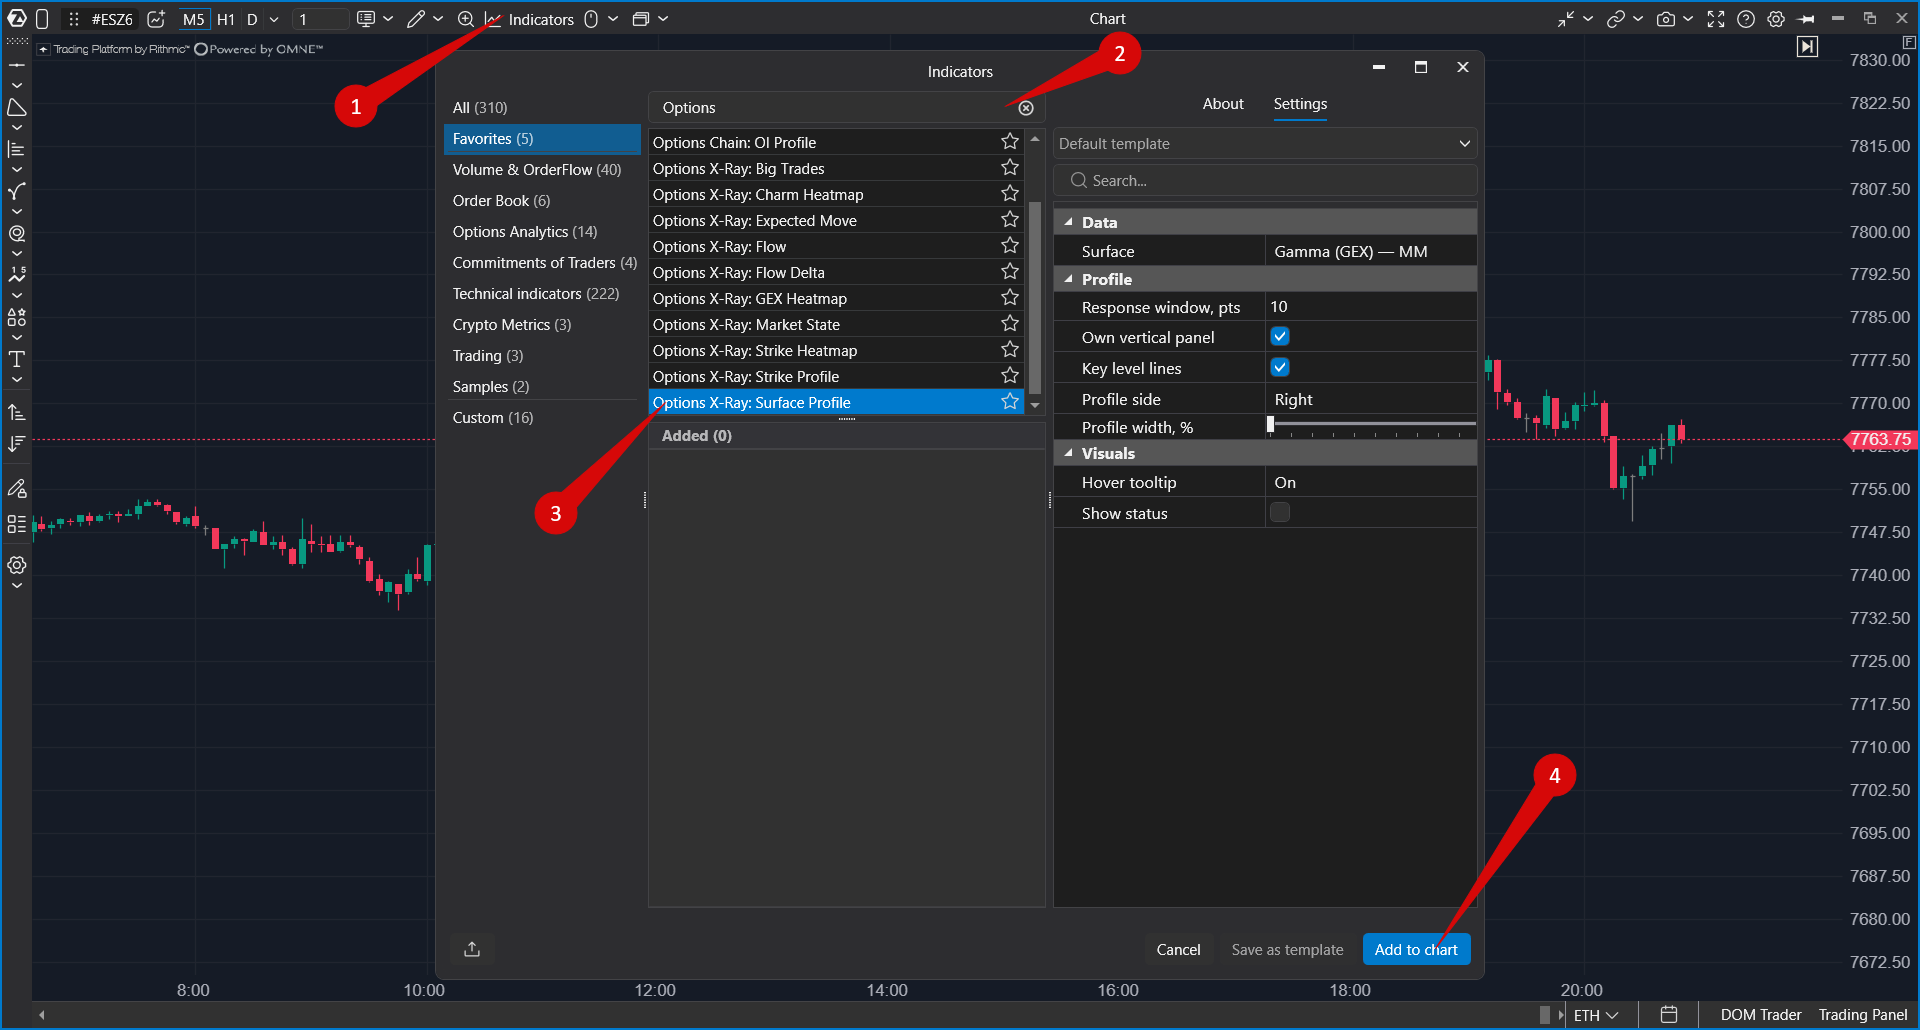
- Open an ES, MES, SPY, or US 500 chart.
- Click Indicators on the top panel.
- Select the Options Analytics group or type Options in search.
- Select Options X-Ray: Surface Profile.
- Click Add to chart.
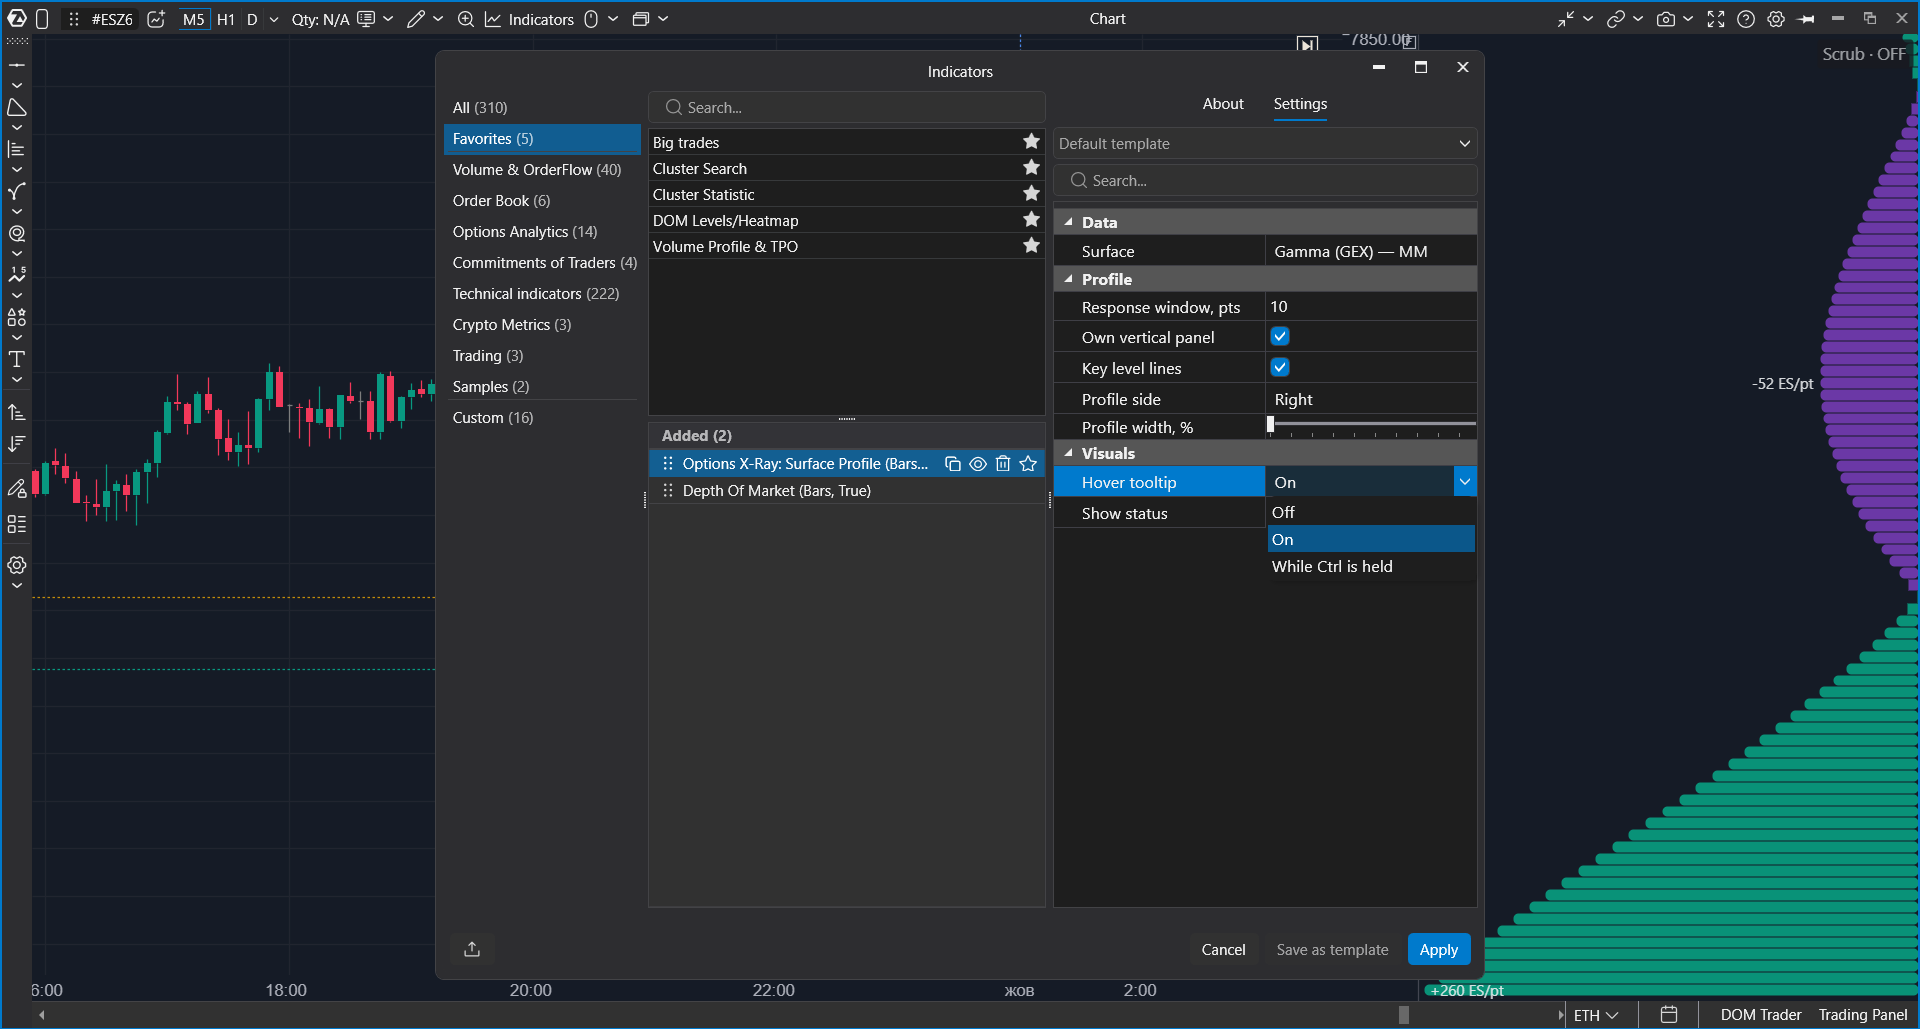
 To change settings later, open Indicators again, select the indicator in the Added section, and click Apply.
Settings
| Setting | What it does |
| Surface | Selects what to show: Gamma (GEX) — MM, Vanna (VEX) — MM, Charm (CEX) — MM, or hedge response to a move. The default is Gamma (GEX) — MM. |
| Response window, pts | Sets how many points are used for the response calculation in hedge-response mode. The default is 10, and the minimum is 4. |
| Own vertical panel | Shows the profile in a separate panel next to the candles. Disabled by default. |
| Key level lines | Shows key level lines on the chart. Enabled by default. |
| Profile side | Selects which side of the chart the profile is drawn on. The default is Right. |
| Profile width, % | Controls profile width as a percentage of chart width. The default is minimal. |
| Hover tooltip | Controls the hover card: Off, On (default), or While Ctrl is held. The Ctrl mode keeps the chart clean and shows the card only on demand. |
| Show status | Shows the indicator status line. It is disabled by default. |
How to Work With the Indicator
| Indicator | How it works with Surface Profile |
| GEX Heatmap | The heatmap shows the landscape for the whole day. Surface Profile gives exact values for a selected moment. |
| Charm Heatmap | Use the same approach for time decay by switching Surface to Charm (CEX) — MM. |
| Strike Profile | Shows positions and forces by strike next to force at each price level. Separate panels make them easier to compare. |
- Check the gamma profile on the last bar: where are the longest damping and amplifying bars near price?
- Switch to hedge-response mode and compare the halves above and below price to see which direction may be easier.
- Move the cursor to the right of the last candle to see how the picture may change toward the close.
- Switch to Charm (CEX) — MM if the passage of time is important for the current setup.
- Confirm entries with tape, clusters, and delta.
Troubleshooting
| What happens | What to do |
| The indicator is not in the list | Check whether the Options X-Ray package is enabled in your account. |
| The profile is not drawn, and the chart shows the chip "Options X-Ray: SPX options data · for ES, MES, SPY and US 500 charts only" | The chart instrument is not supported. Open an ES, MES, SPY, or US 500 chart. |
| The profile is not drawn or is very narrow on a supported chart | The default profile width is minimal; increase Profile width, %. |
| There is no hedge-response mode for vanna or charm | This is expected. Hedge response to price movement makes sense only for gamma. |
| The response window cannot be set below 4 points | This is expected. Levels are calculated in 2.5-point steps, and a smaller window would not add meaningful levels. |
| Bars became lighter | The cursor is to the right of the last candle. This is a forecast, not observed history. |
| Levels look inaccurate, and the status mentions calibration | The chart does not have enough history to map index levels to the chart accurately. Load more days on the chart and enable Show status if needed. |
Was this article helpful?
That’s Great!
Thank you for your feedback
Sorry! We couldn't be helpful
Thank you for your feedback
Feedback sent
We appreciate your effort and will try to fix the article