The Chart Window is the main workspace for viewing market data, analyzing price movement, working with indicators and drawing objects, and placing or managing orders from the chart when trading is enabled.
Use the Chart Window when you want to analyze an instrument, change the chart type or timeframe, apply templates, add indicators, draw levels, open linked modules, take screenshots, or enable trading tools such as Trading Panel and DOM Trader.
Opening a Chart
To open a chart:
- Open the main ATAS window.
- Click Chart.
- Select an instrument in the Instruments Manager.
- Double-click the instrument or confirm the selection.
A new Chart Window opens for the selected instrument. You can then change the instrument, timeframe, chart type, indicators, and visual settings without opening a new workspace.
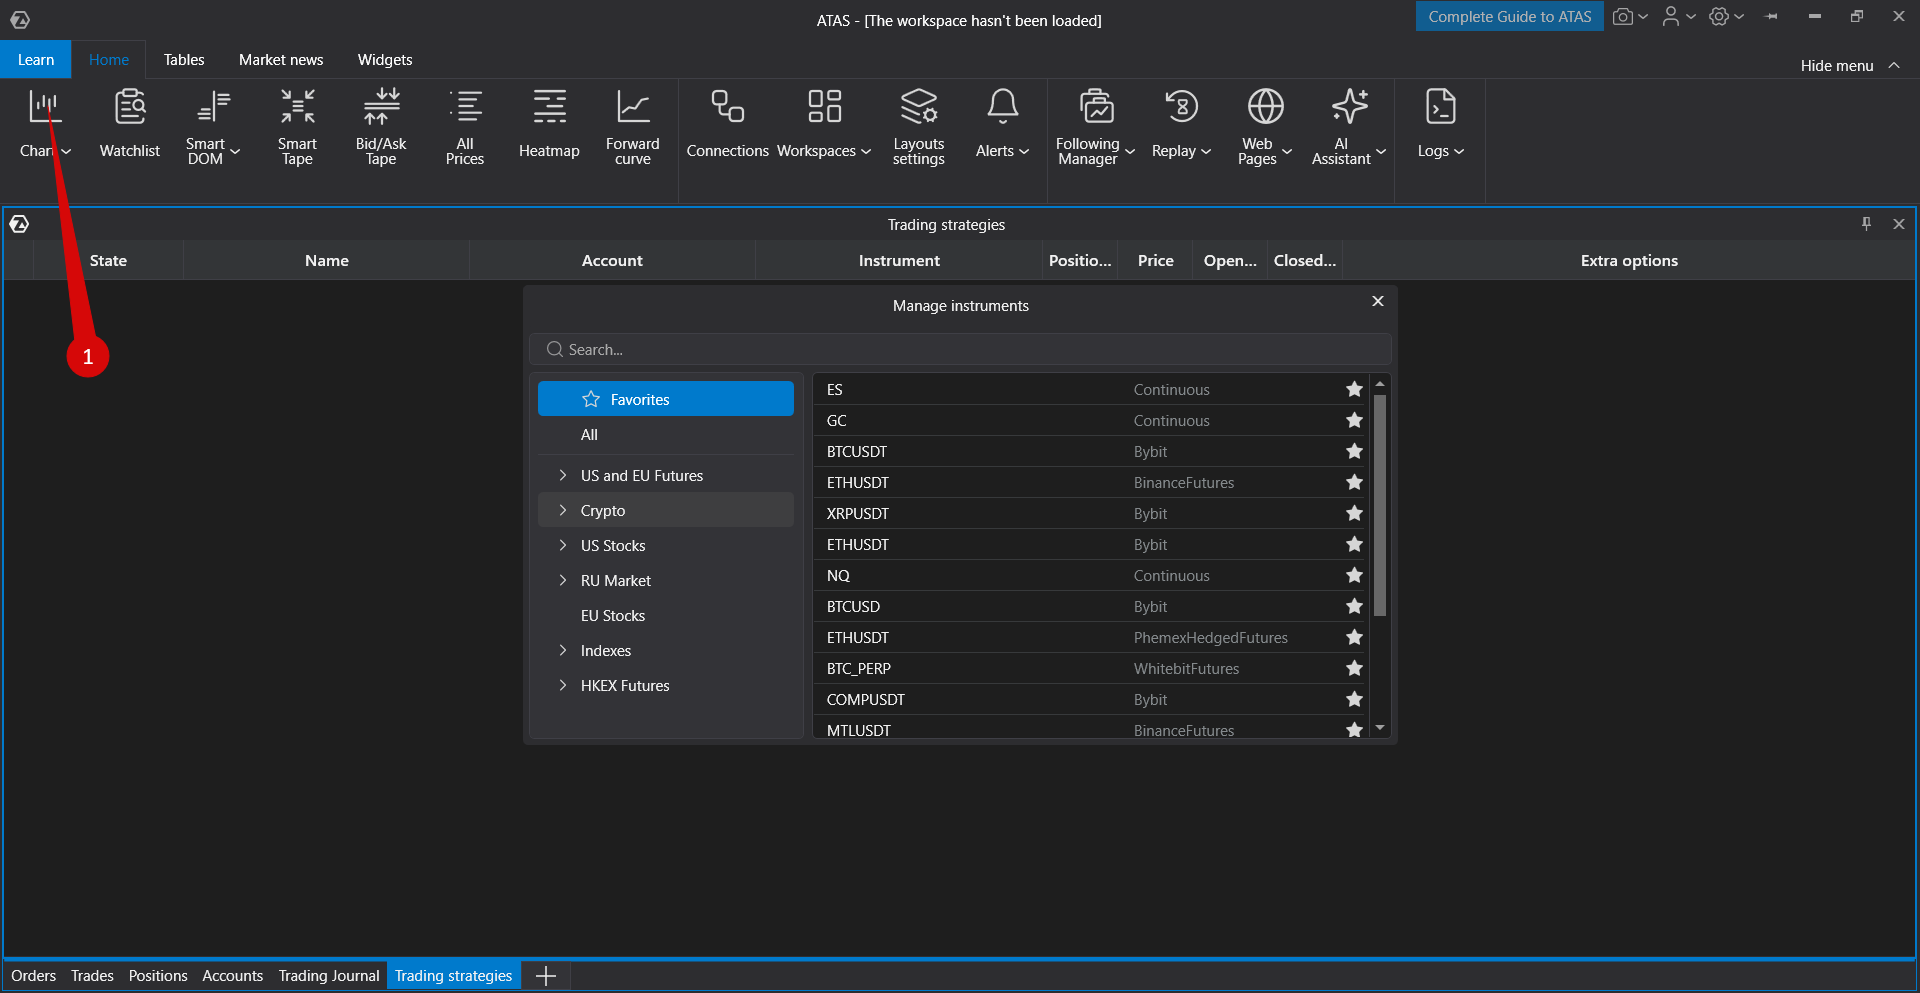
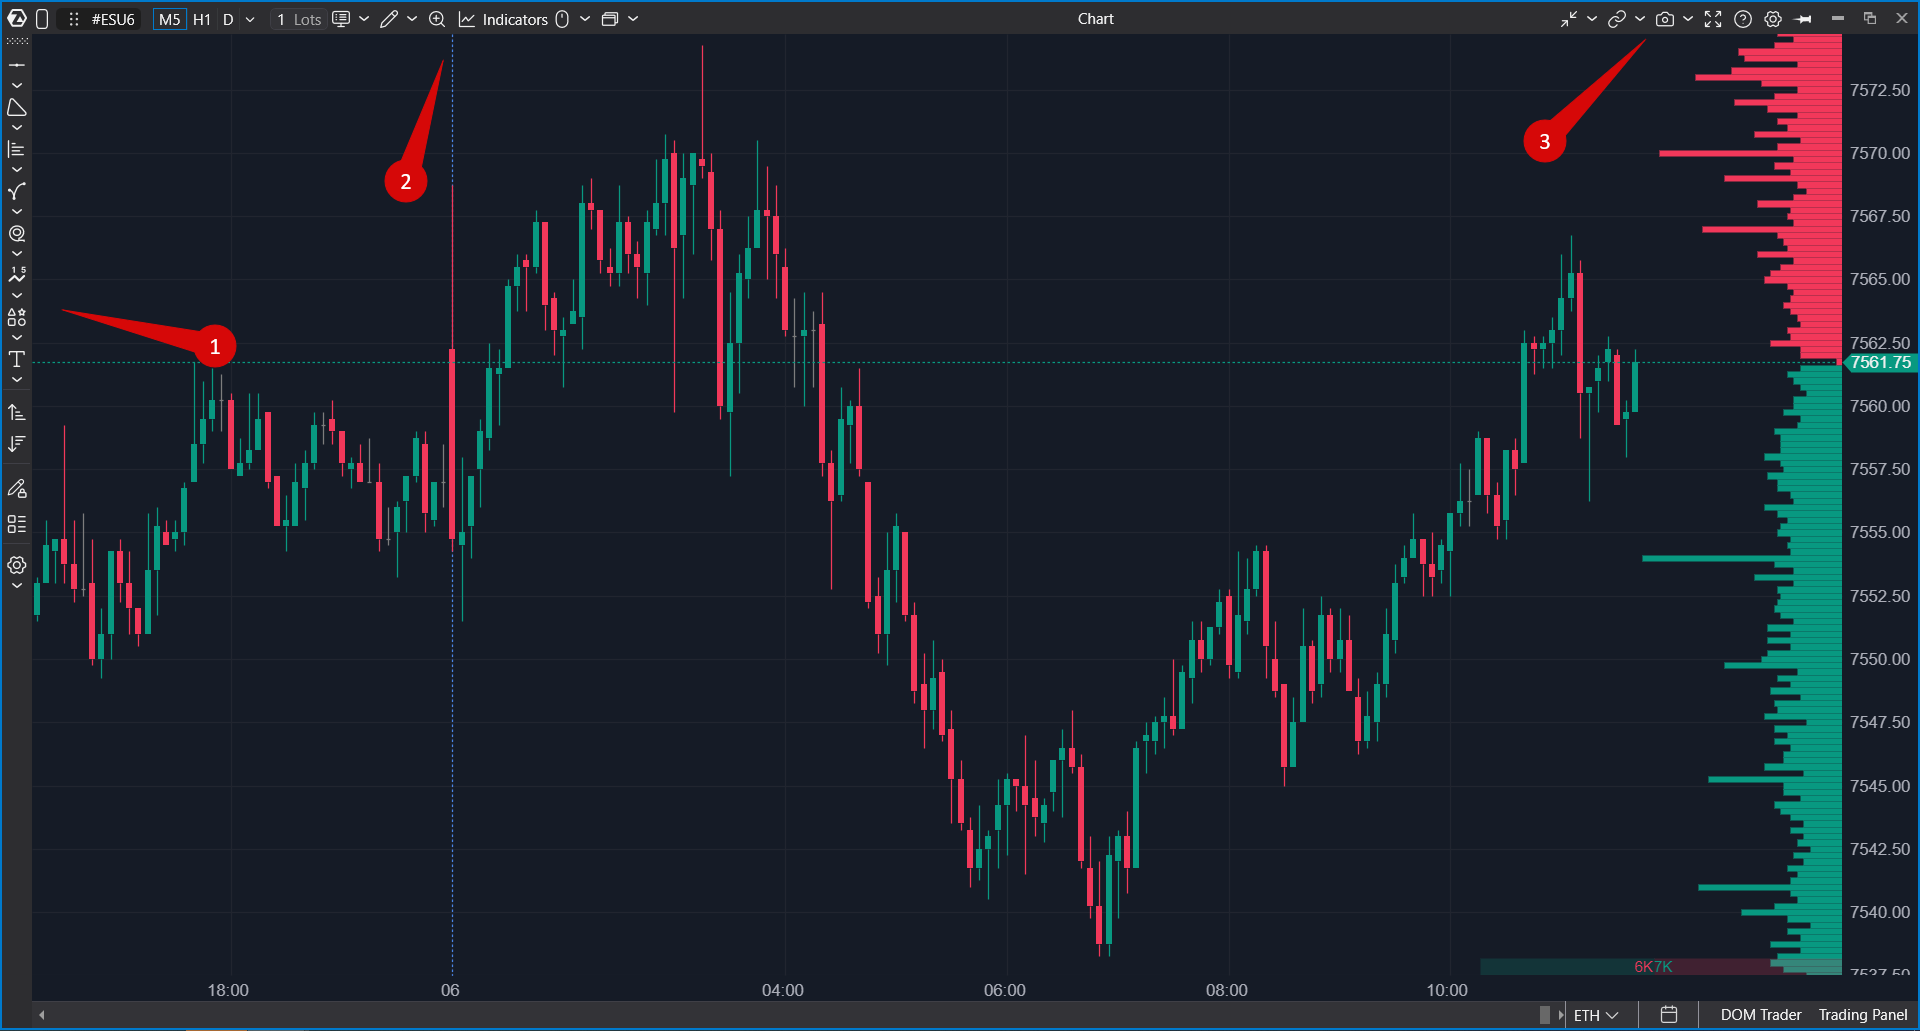
Chart Window Structure
The Chart Window contains several main areas:
- Top Toolbar — contains instrument, overlay, timeframe, chart type, drawing, indicators, templates, screenshot, fullscreen, and settings controls.
- Chart Area — displays candles, bars, clusters, line chart, or another selected chart mode.
- Price Scale — shows price levels and can be used for scaling and quick drawing actions.
- Time Scale — shows time or bar sequence and helps navigate through chart history.
- Drawing Toolbar — gives quick access to drawing tools when enabled.
- Chart Trader Panel — appears when Chart Trader is enabled.
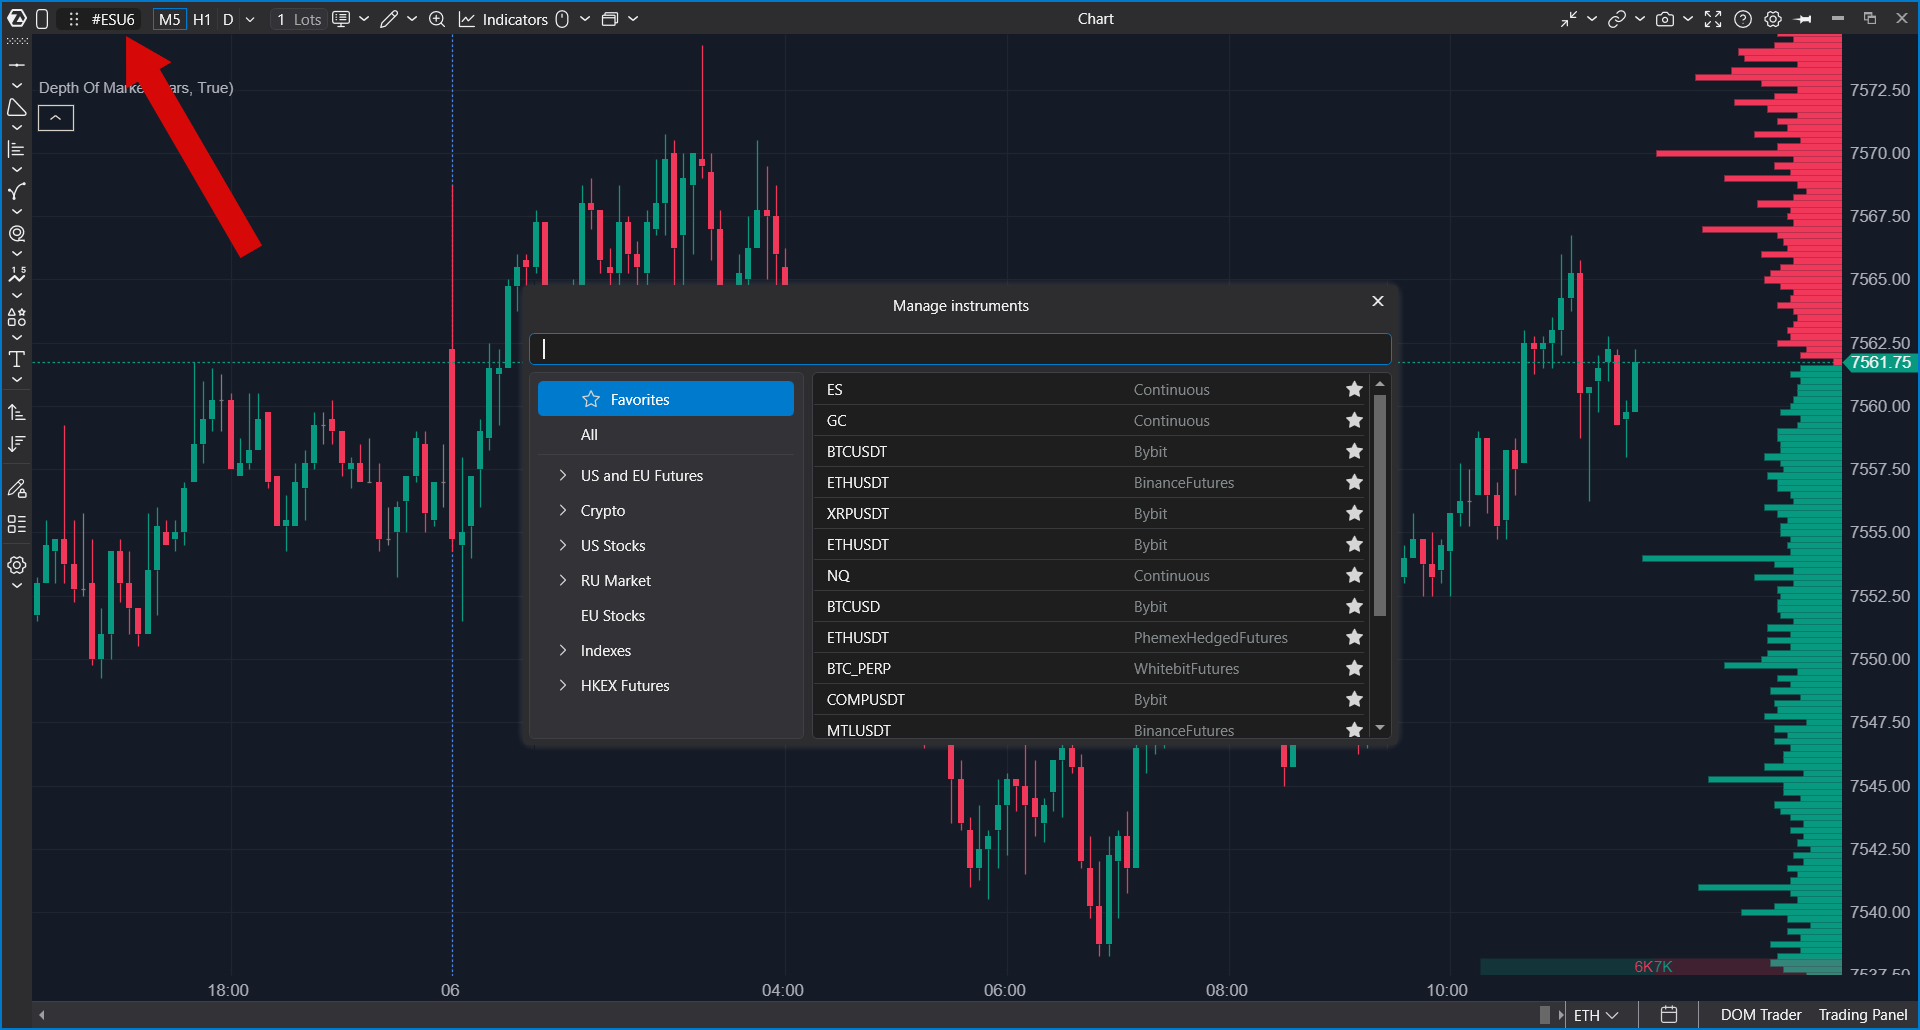
Instrument and Window Grouping
The instrument selector shows the current chart instrument. Use it when you want to change the instrument in the same Chart Window while keeping the chart setup, indicators, drawing objects, and templates.
If the Chart Window is assigned to a window group, changing the instrument can also update other windows in the same group. This is useful when several modules should follow the same symbol.
Overlay
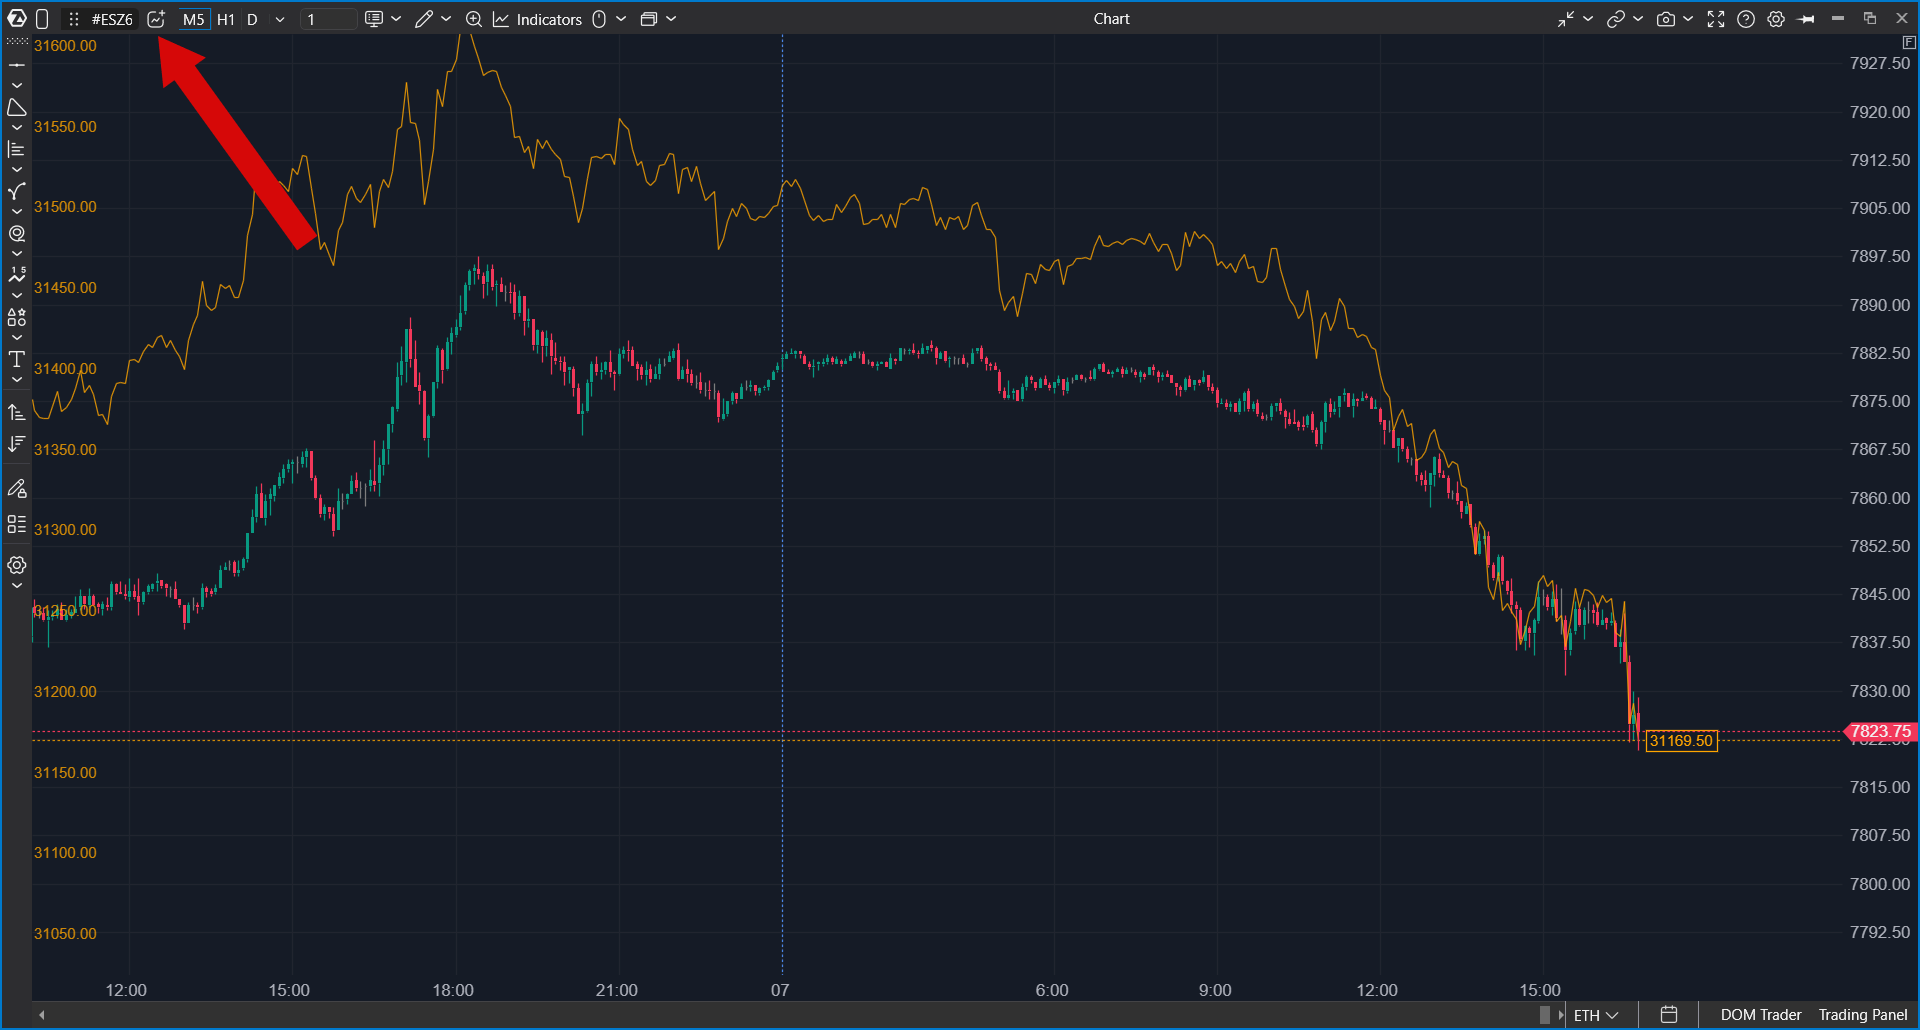
The Overlay button next to the instrument selector adds a second instrument on top of the chart, for example NQ on an ES chart. The overlay uses the chart timeframe and has its own scale on the left, so you can compare two markets bar by bar without opening another window. To learn how to add, configure and remove an overlay, read Overlay: Another Instrument on the Chart.
Timeframe and Chart Period
The timeframe selector controls the period or chart type used to build bars. Depending on the selected market and data, you can use time-based periods and other chart types such as tick, volume, range, delta, or other available ATAS chart periods.
You can also use favorite timeframes for quick switching.
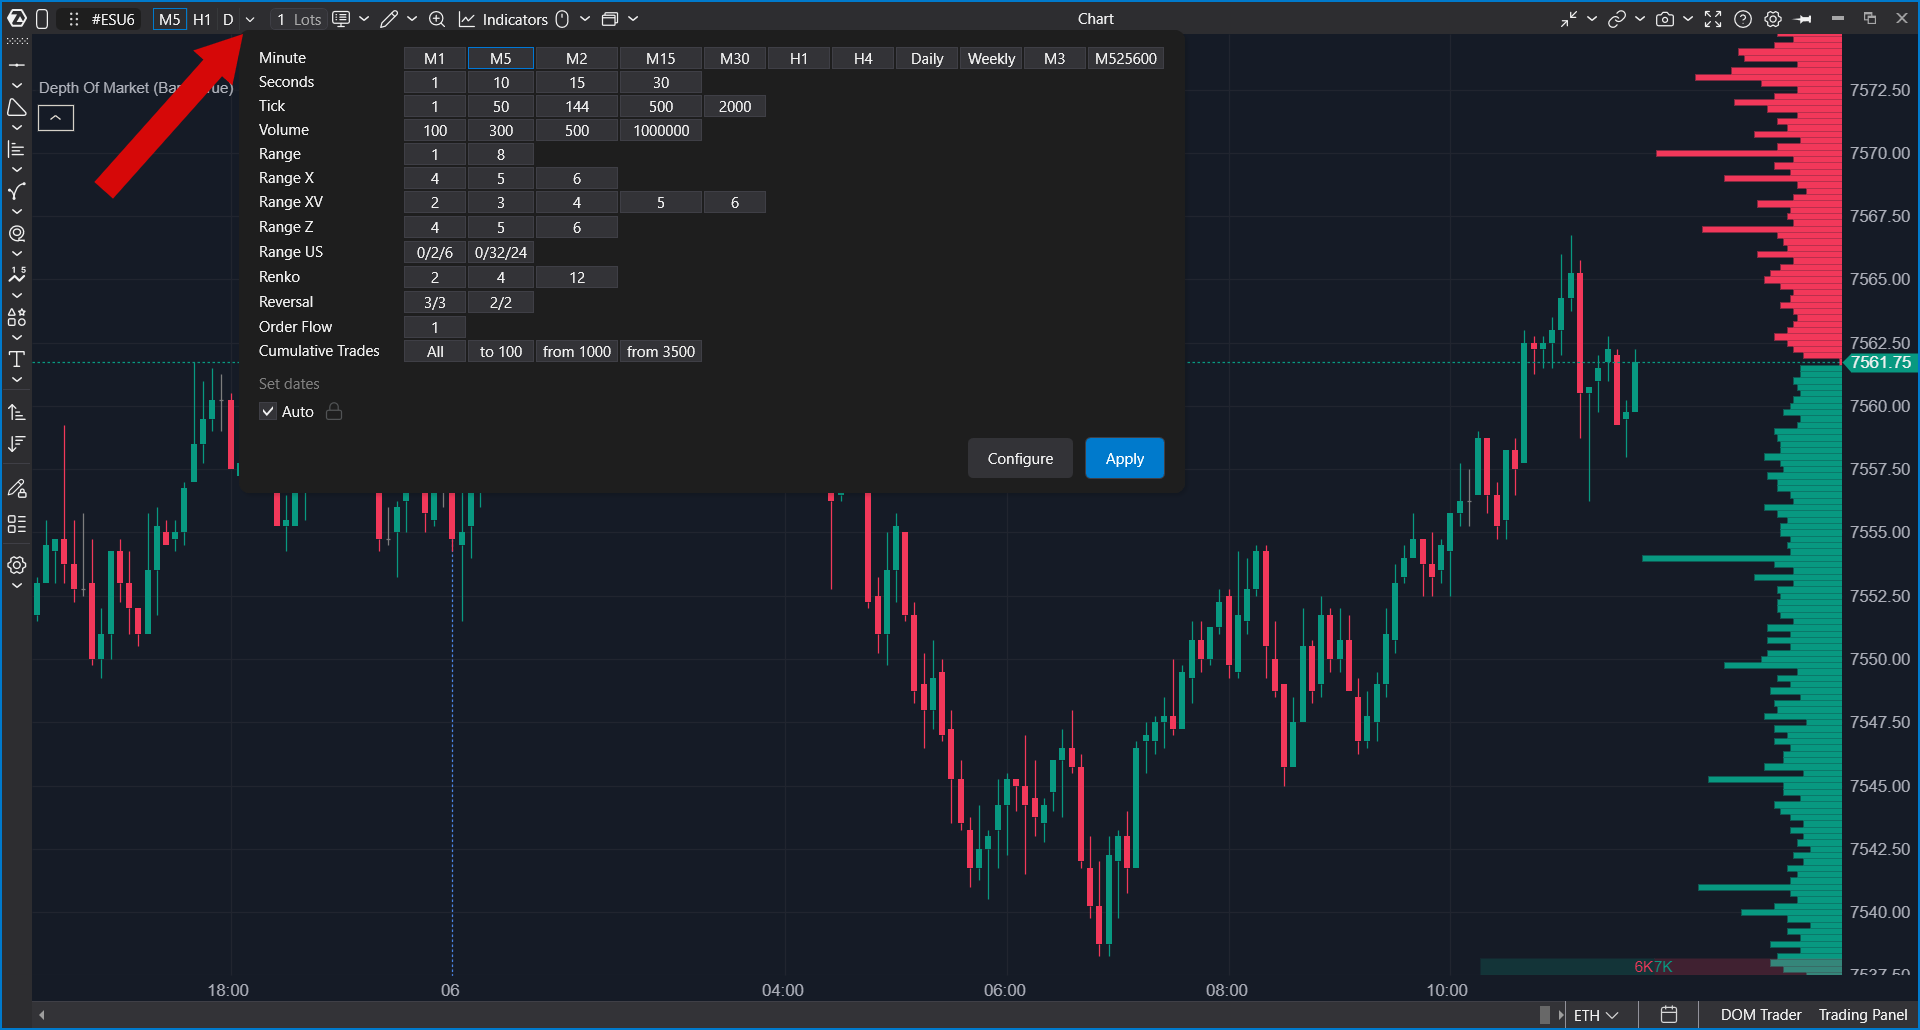
Chart Display Mode
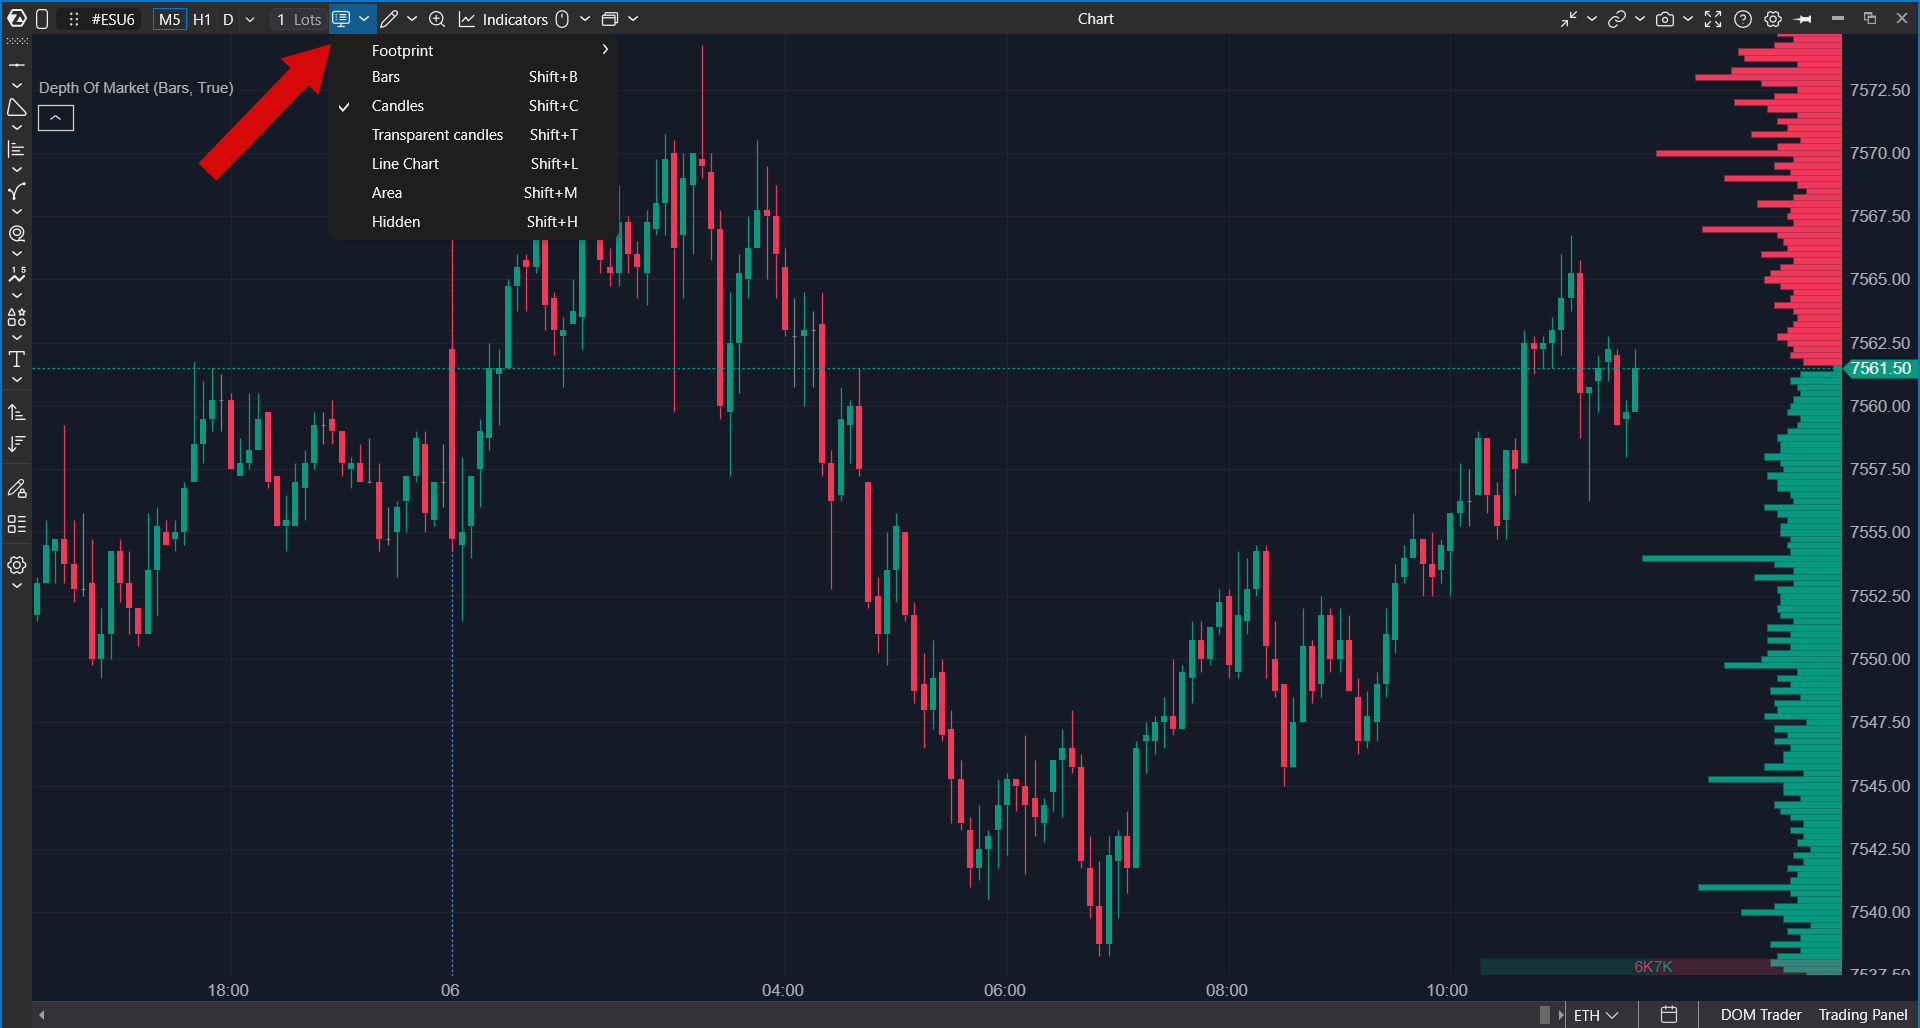
The chart display mode controls how chart data is drawn.
Available display modes may include:
- Bars
- Candles
- Transparent Candles
- Line Chart
- Clusters
- Mountain Chart
- Hidden
Use display modes to switch between a classic price view, footprint or cluster analysis, line-based analysis, or a simplified hidden-price mode.
Volume Selector for Trading
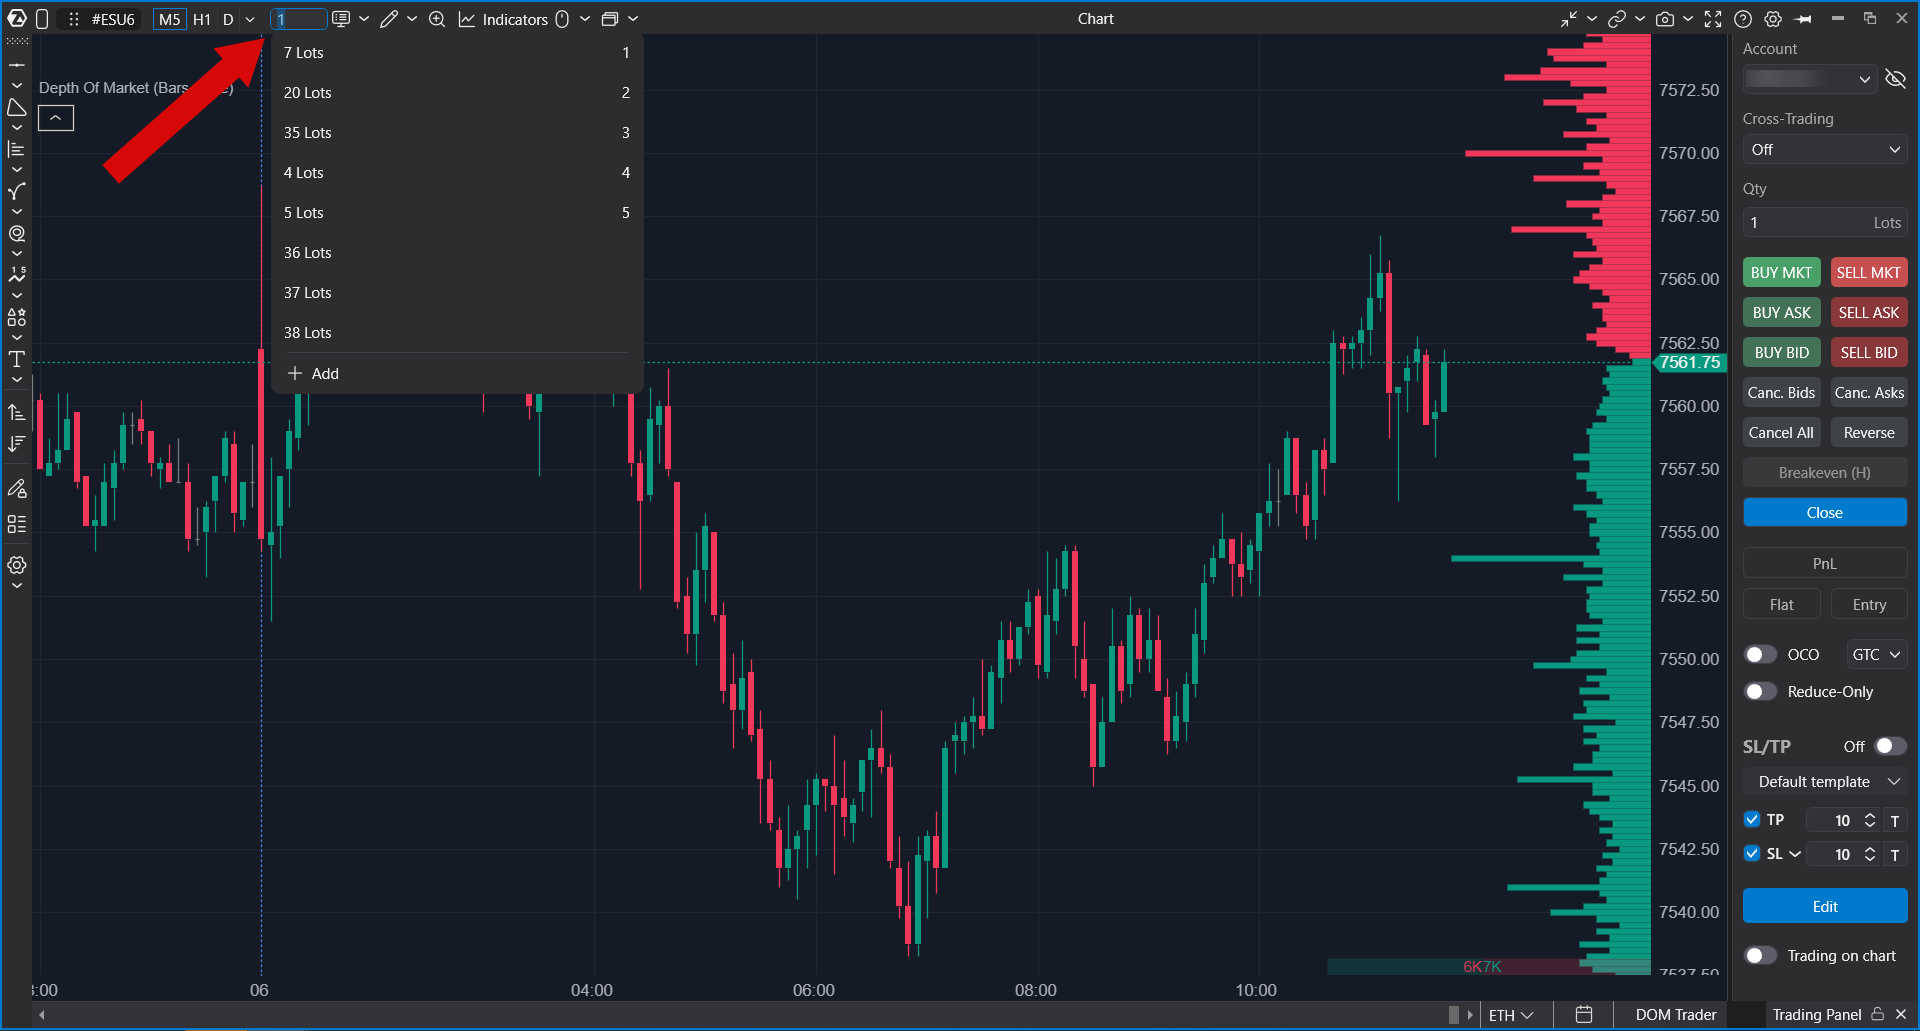
The volume selector lets you choose the order volume used by trading actions from the Chart Window and Chart Trader.
You can usually:
- select a predefined volume;
- enter a custom value manually;
- switch volume using hotkeys if volume hotkeys are configured.
The selected volume is used for chart trading actions and trading buttons. Always check it before placing an order.
Mouse and Crosshair Modes
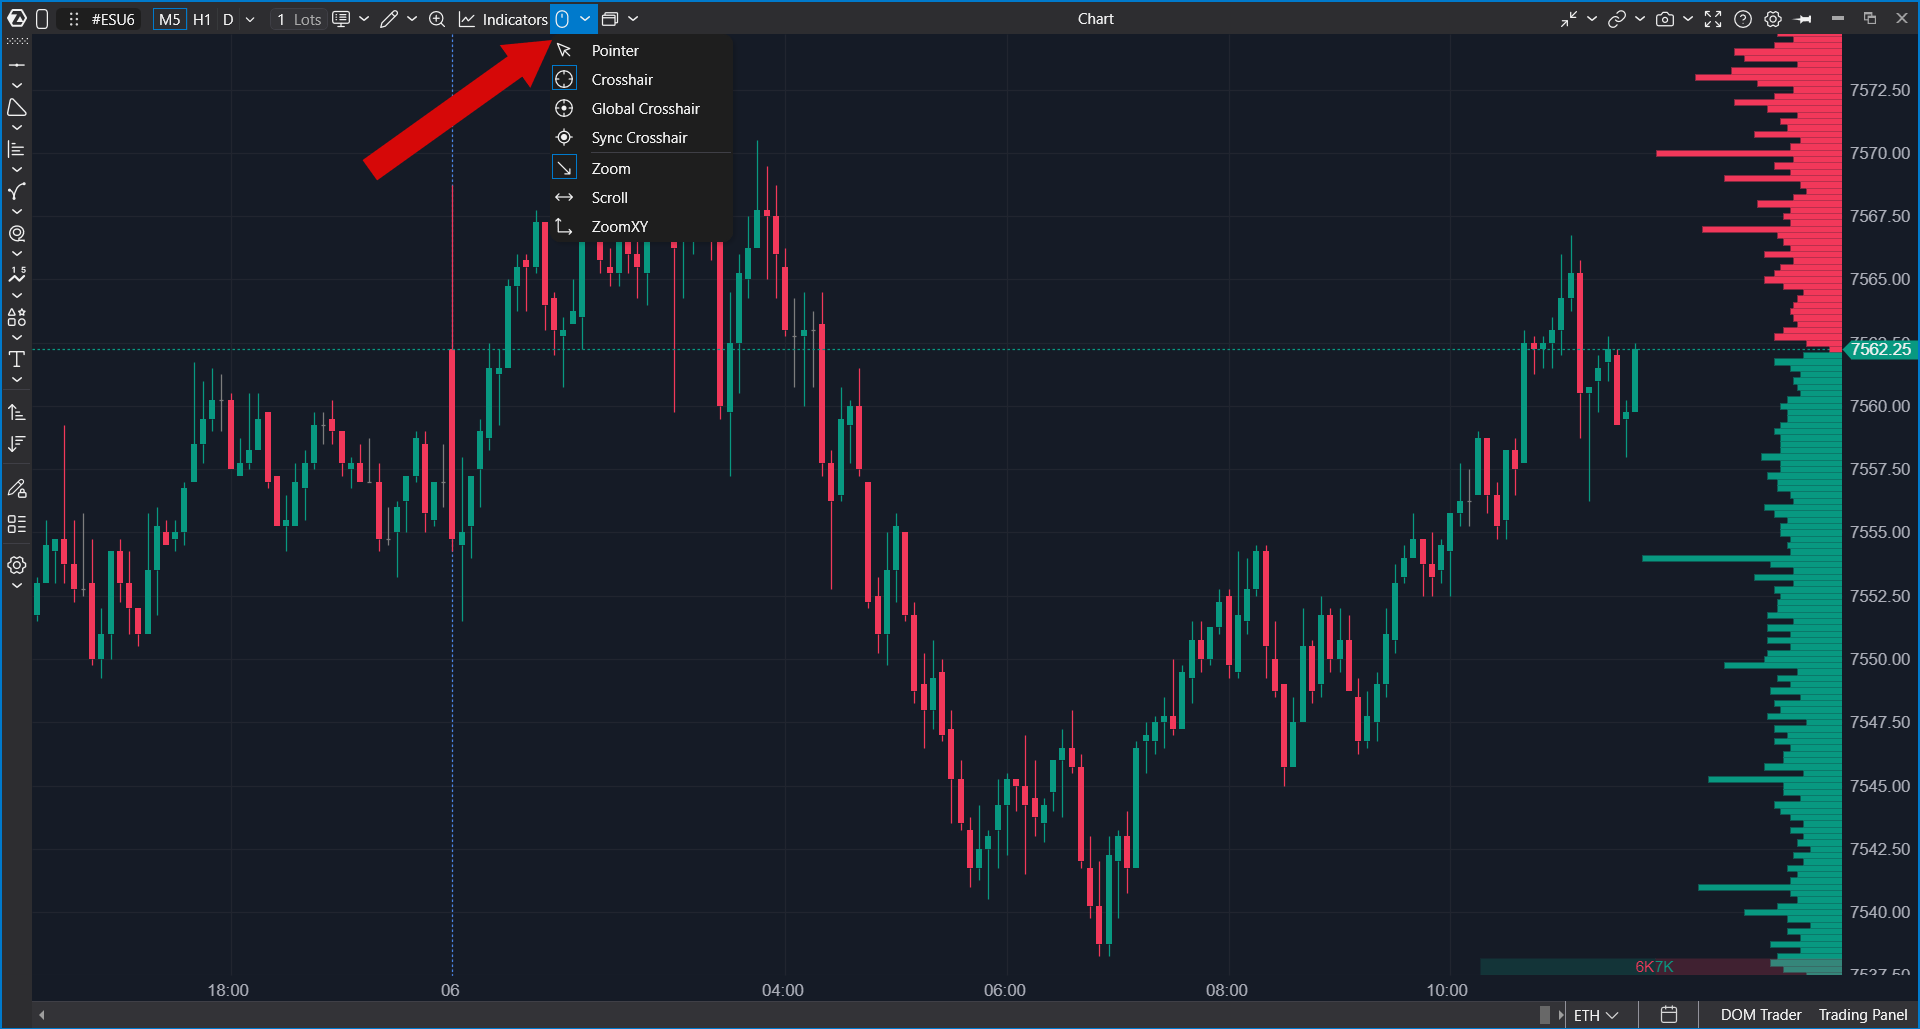
The mouse and crosshair menu controls cursor behavior on the chart.
Available modes may include:
- Pointer — regular chart cursor.
- Crosshair — shows vertical and horizontal crosshair lines.
- Global Crosshair — synchronizes crosshair behavior across supported linked windows.
- Sync Crosshair — synchronizes crosshair position with linked chart tools.
The same menu may also include mouse wheel behavior, such as zooming, scrolling, or zooming both axes.
Magnifier Mode
Magnifier Mode lets you zoom into a selected part of the chart. This is especially useful when working with clusters or footprint data inside candles.
You can enable it from the toolbar or with the assigned hotkey if it is configured in the hotkey settings.
Drawing Objects
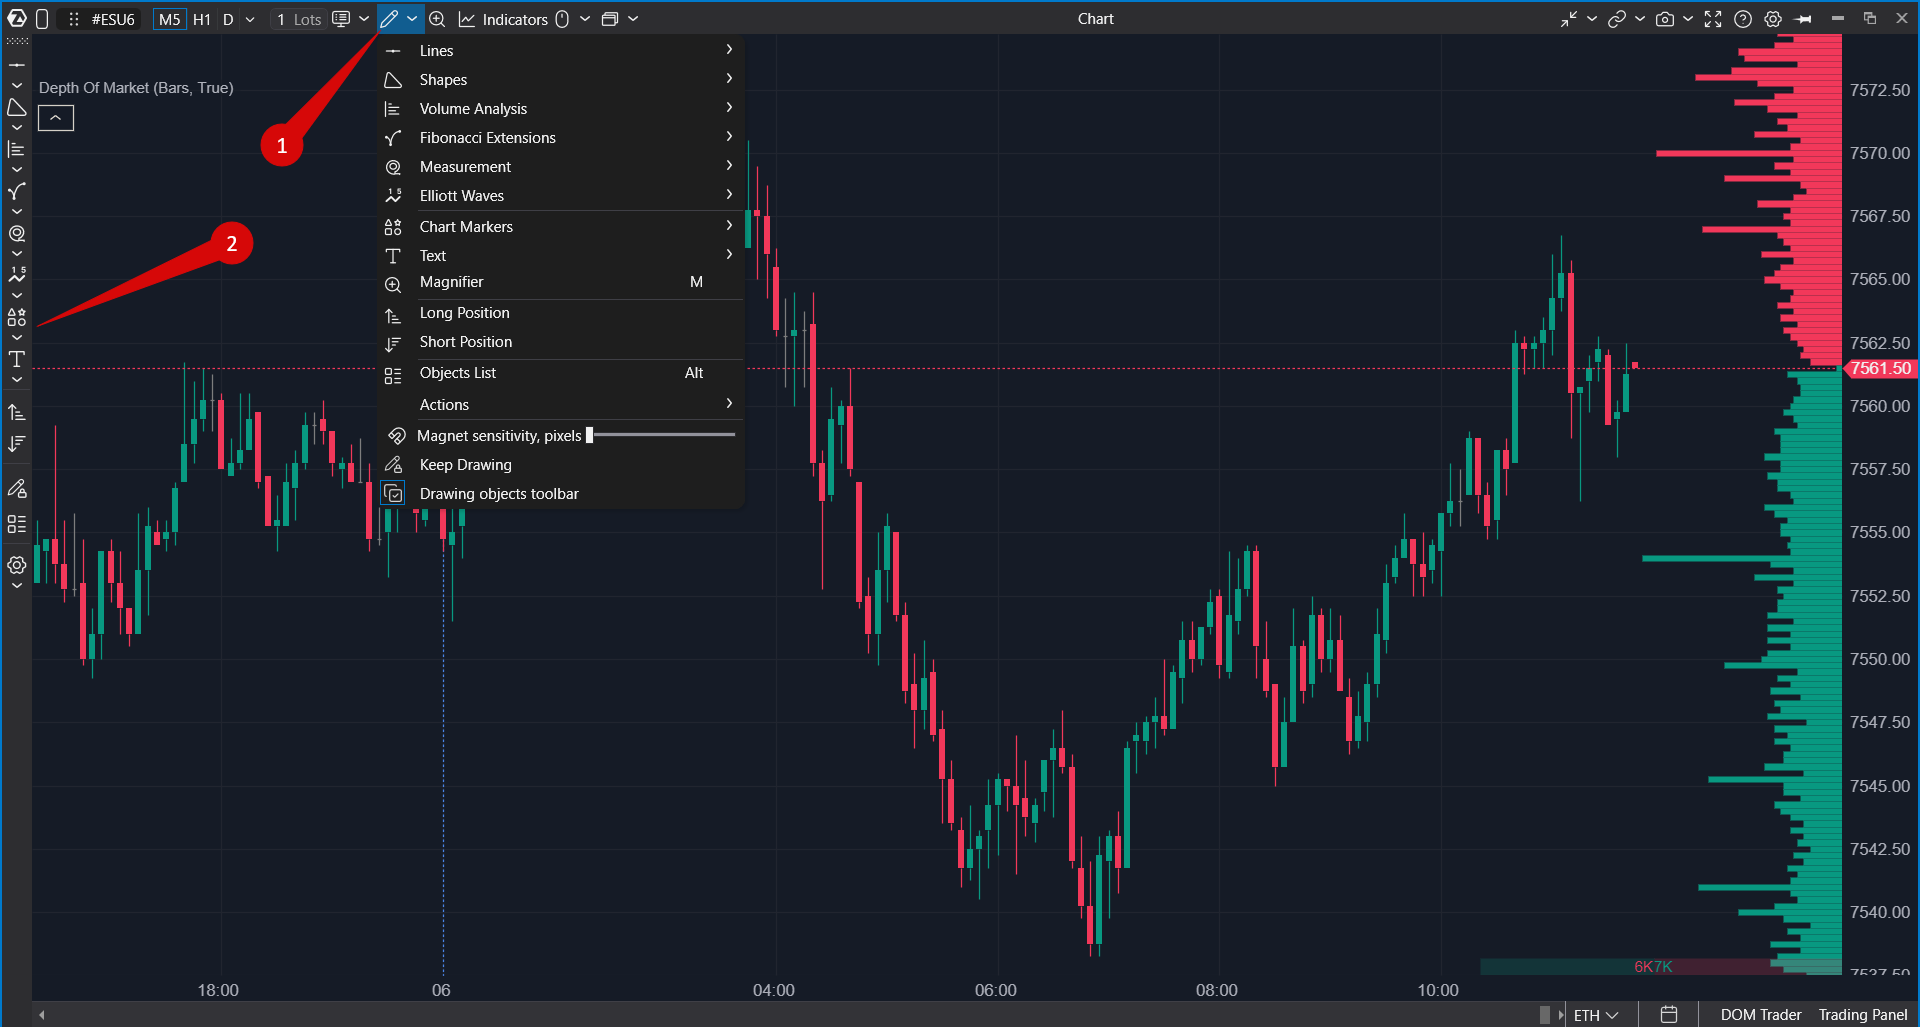
The drawing tools menu lets you add markup and analysis objects to the chart.
Available tools may include:
- trend line, angle, vertical line, horizontal line, and horizontal ray;
- brush, cross line, price channel, triangle, rectangle, and ellipse;
- market profile, fixed market profile, anchored market profile, VWAP, Dynamic POC, and CVD correlation;
- Fibonacci tools, ruler, and measurement tools;
- chart markers, text, labels, and price labels;
- long position and short position drawing tools;
- Elliott Wave tools.
The drawing tools menu also provides actions such as object list, keep drawing mode, drawing toolbar visibility, locking objects, hiding objects, copying, pasting, undoing, and deleting selected or all drawing objects.
Indicators
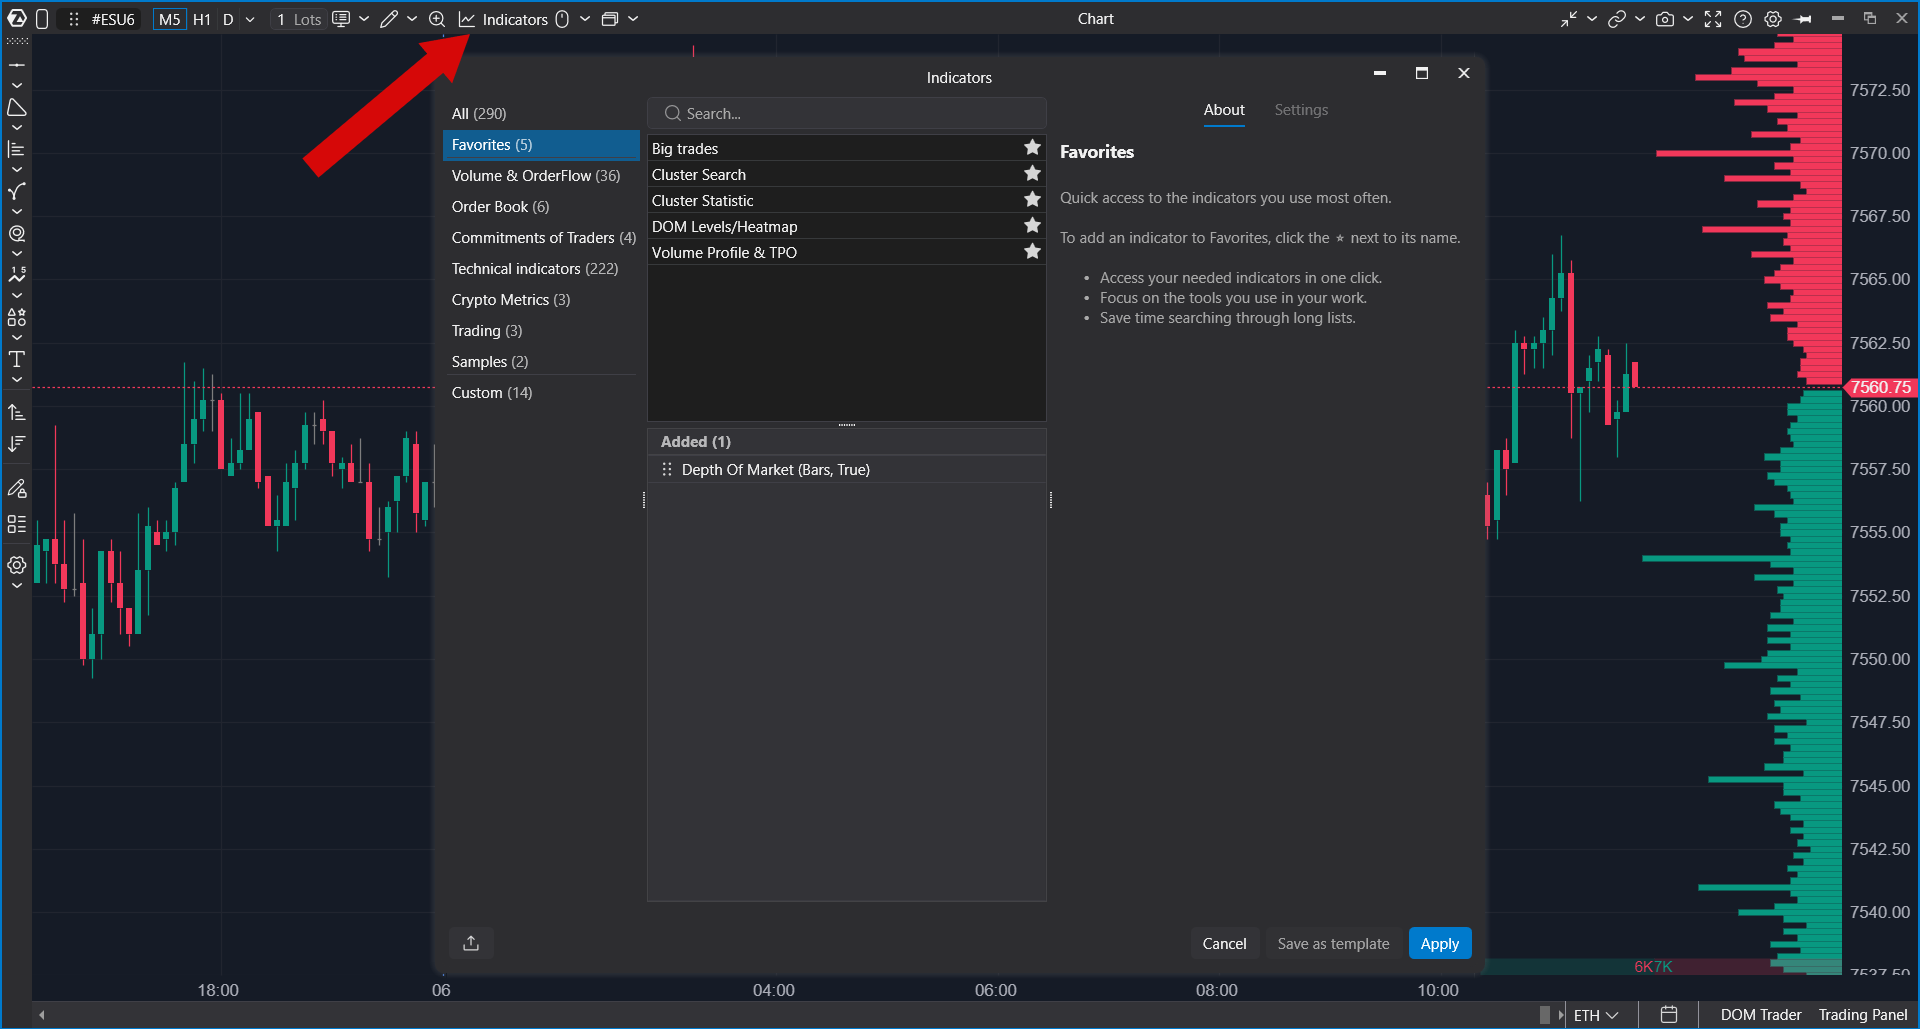
The Indicators button opens the indicator management window for the current chart. Use it to add, remove, configure, or reorder indicators.
Indicators added to the chart are saved with chart templates or workspace settings, depending on how you save your setup.
Templates
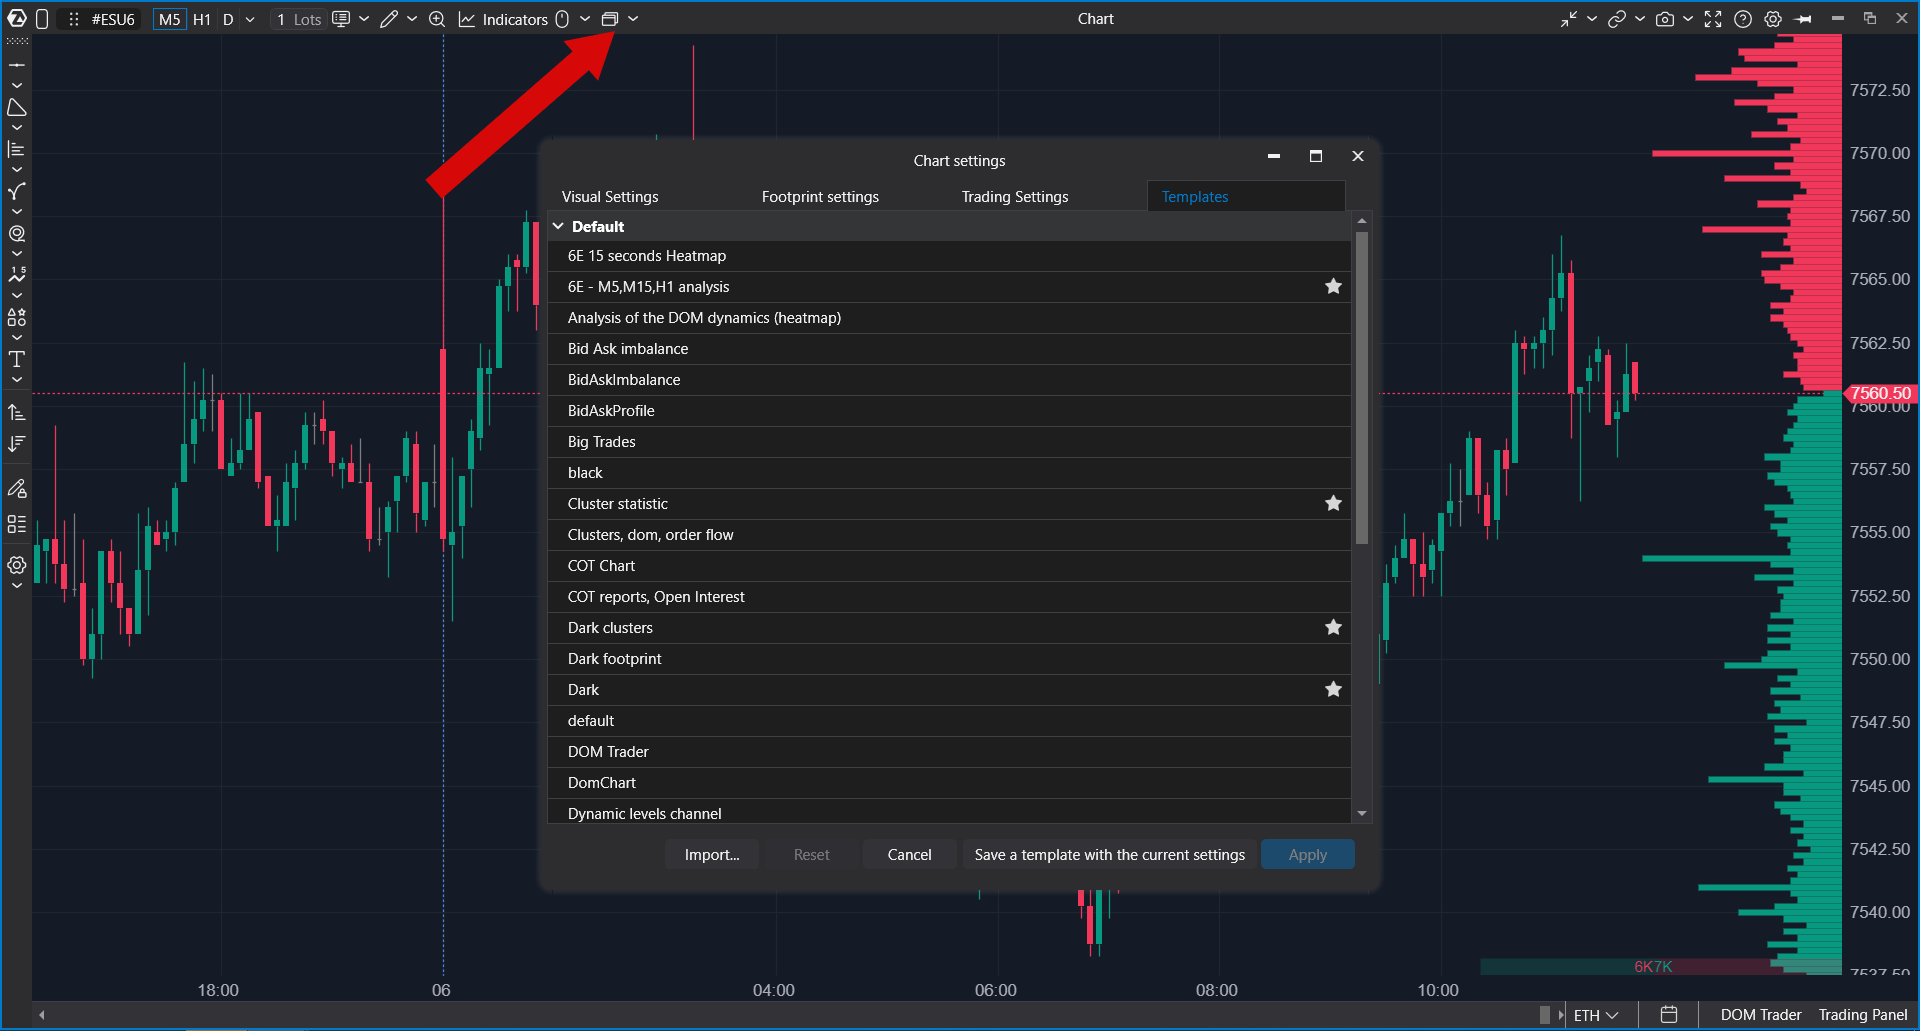
The Templates menu gives quick access to chart templates.
Use templates when you want to reuse a chart setup, including chart type, visual settings, indicators, and other saved configuration.
The menu can show favorite templates. Open Settings inside the Templates menu to manage them.
Scale
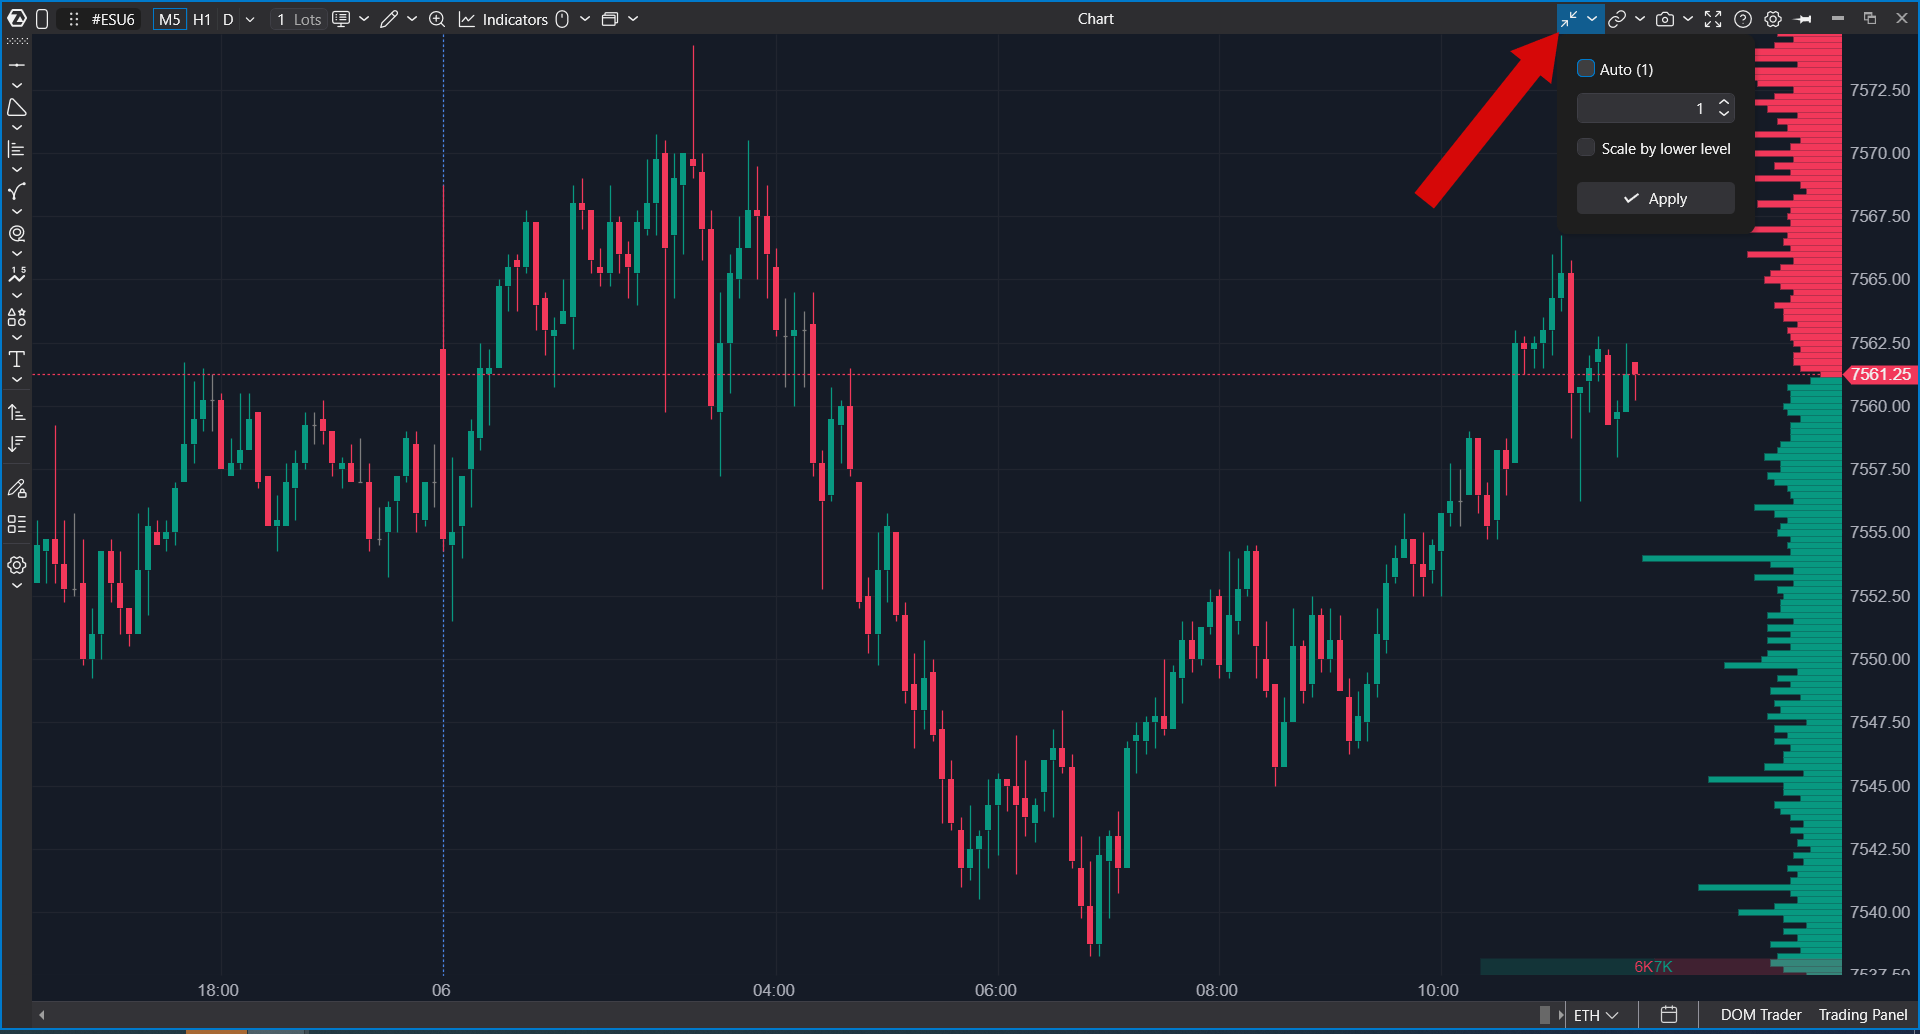
The Scale menu opens chart scale settings. Use it to adjust how the price scale behaves and how the chart is displayed vertically.
Scale settings are useful when the chart is too compressed, too expanded, or when you need more control over price axis behavior.
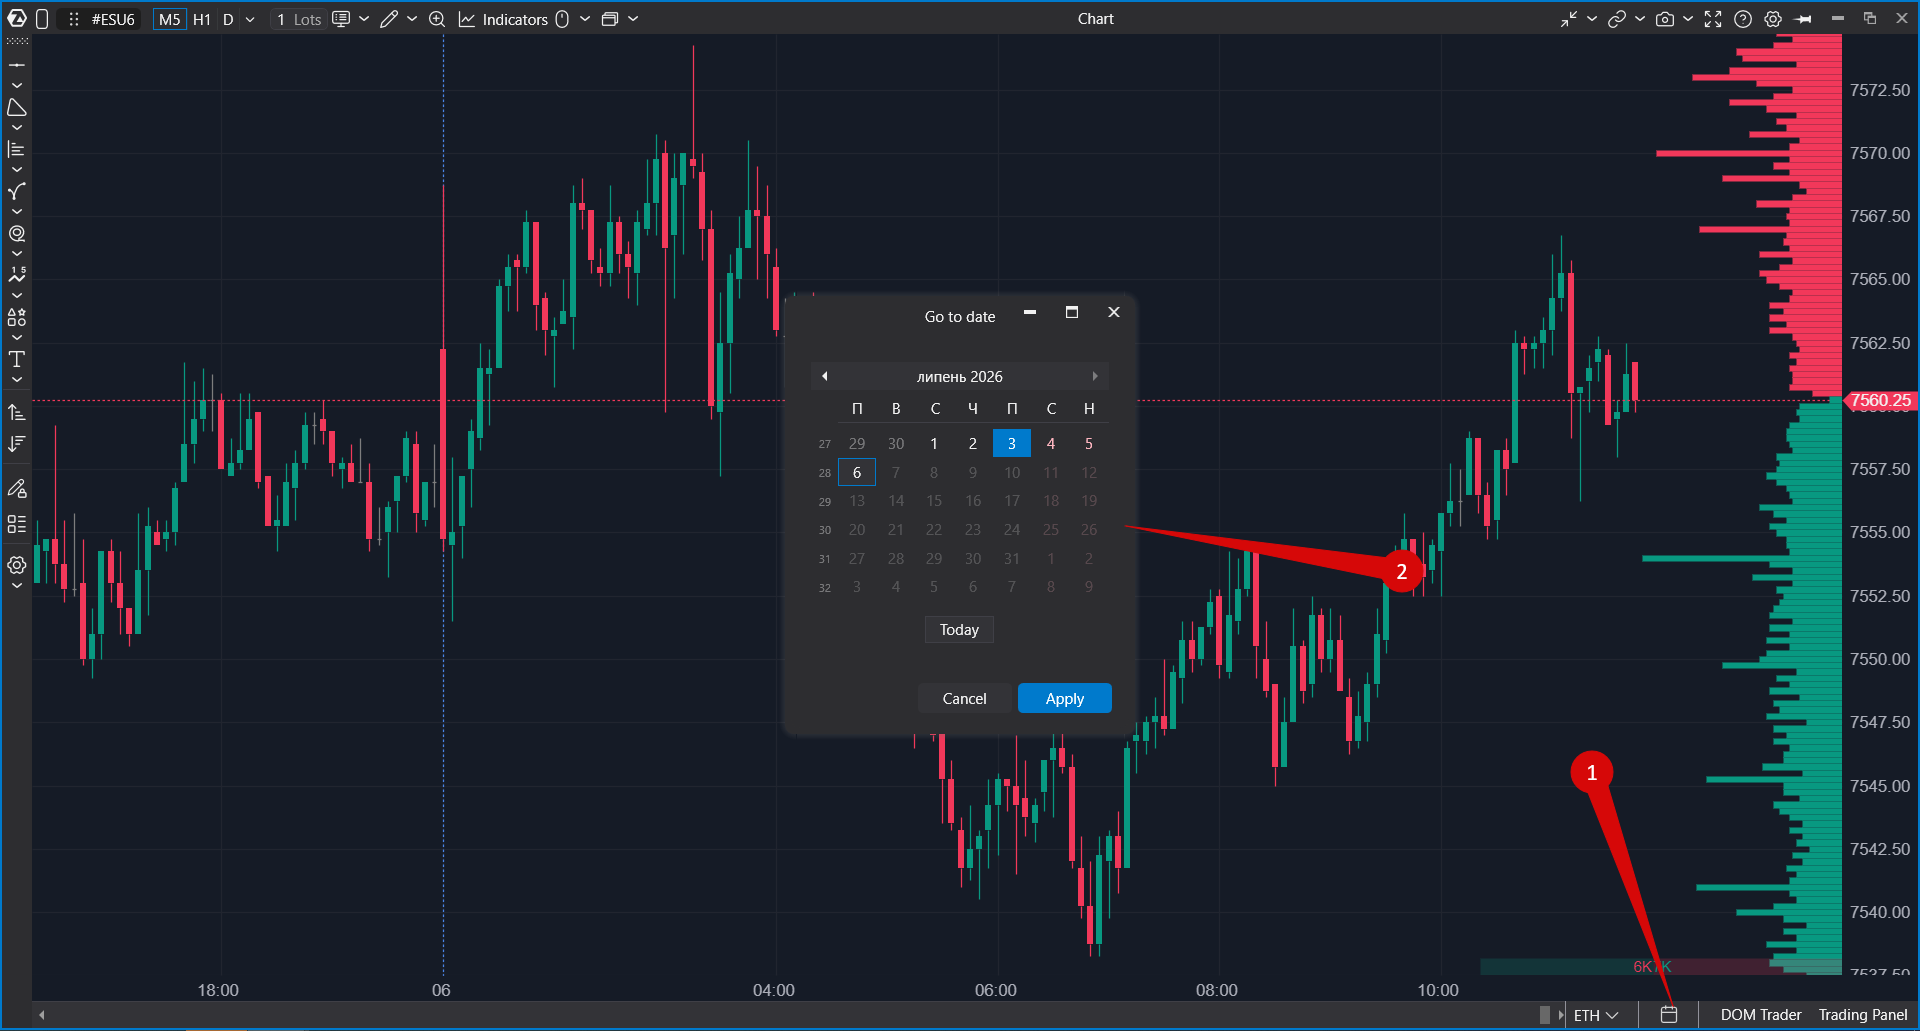
Go to Date
The Go to Date command lets you navigate to a specific date or time in chart history.
Use it when you need to review a past trading session, analyze a historical event, or return to a known point on the chart.
Linked Windows
The Linked Windows menu lets you work with other modules connected to the same instrument or chart context.
Depending on your setup, you can open linked modules such as Smart Tape or Bid/Ask Tape and choose the linked windows mode.
Linked windows can work in two main ways:
- Real-Time Mode — linked windows follow the current real-time instrument and data.
- Historical Mode — linked windows can be used to inspect historical data from a selected chart range.
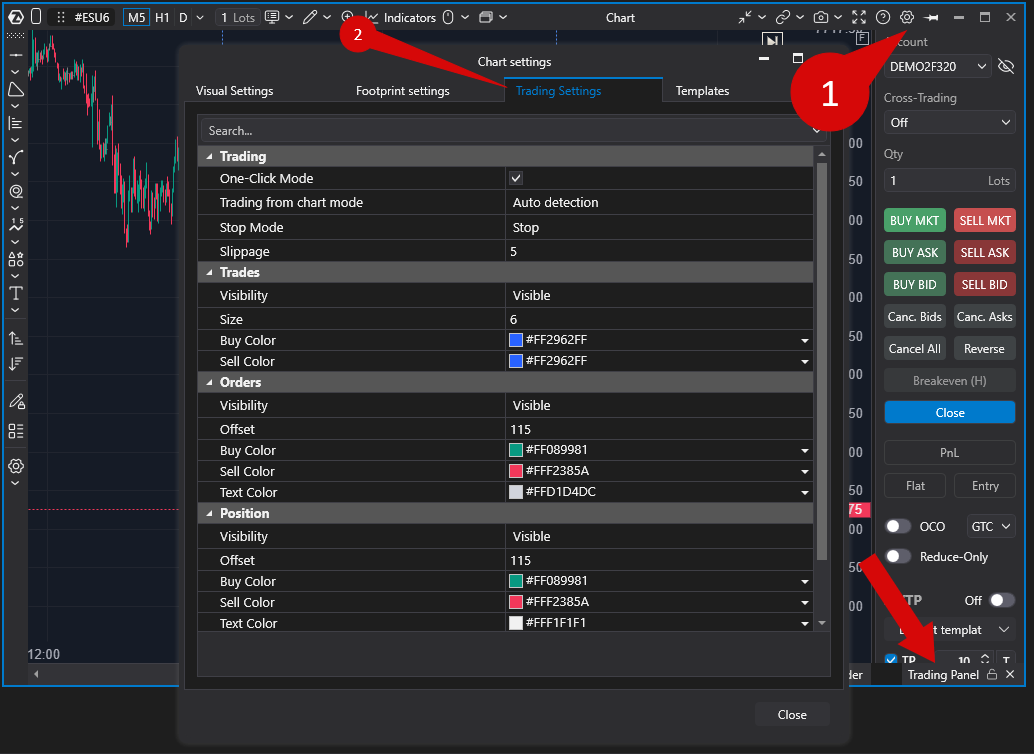
Trading
The Trading menu contains Trading Panel controls and access to trading-related settings.
Depending on the current connection and platform configuration, you can:
- enable or disable Trading Panel;
- configure Trading Settings;
- manage trading controls available on the chart.
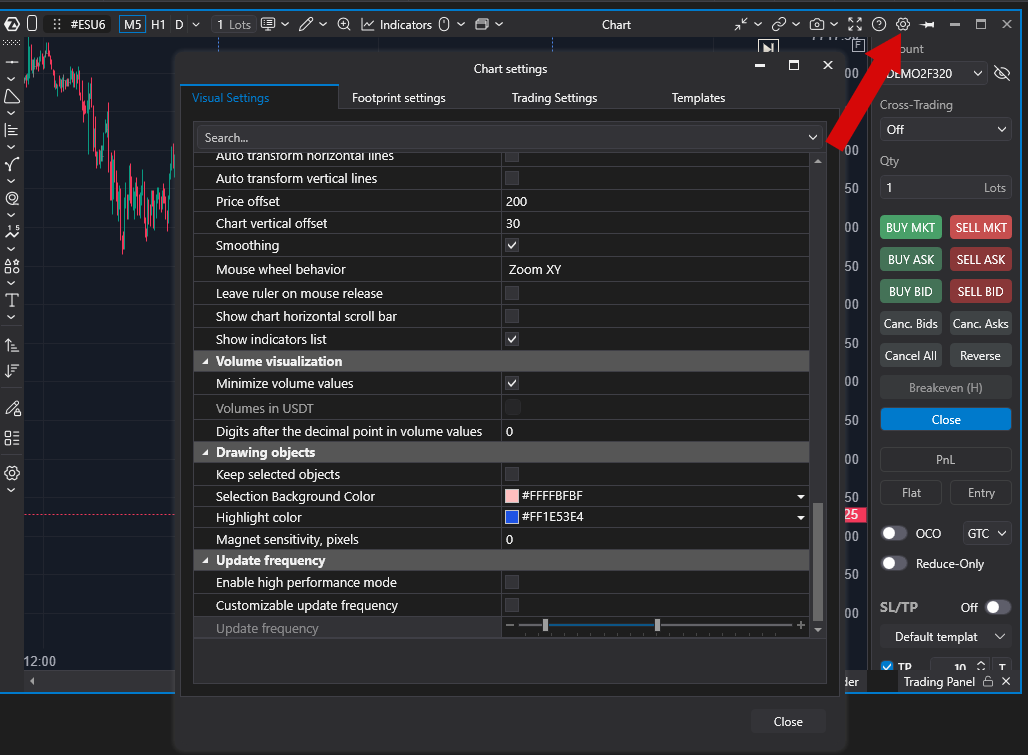
Settings
The Settings menu opens the chart configuration window.
Here you can customize chart appearance, trading behavior, scaling, visual elements, sessions, indicators, colors, templates, and other chart-specific parameters.
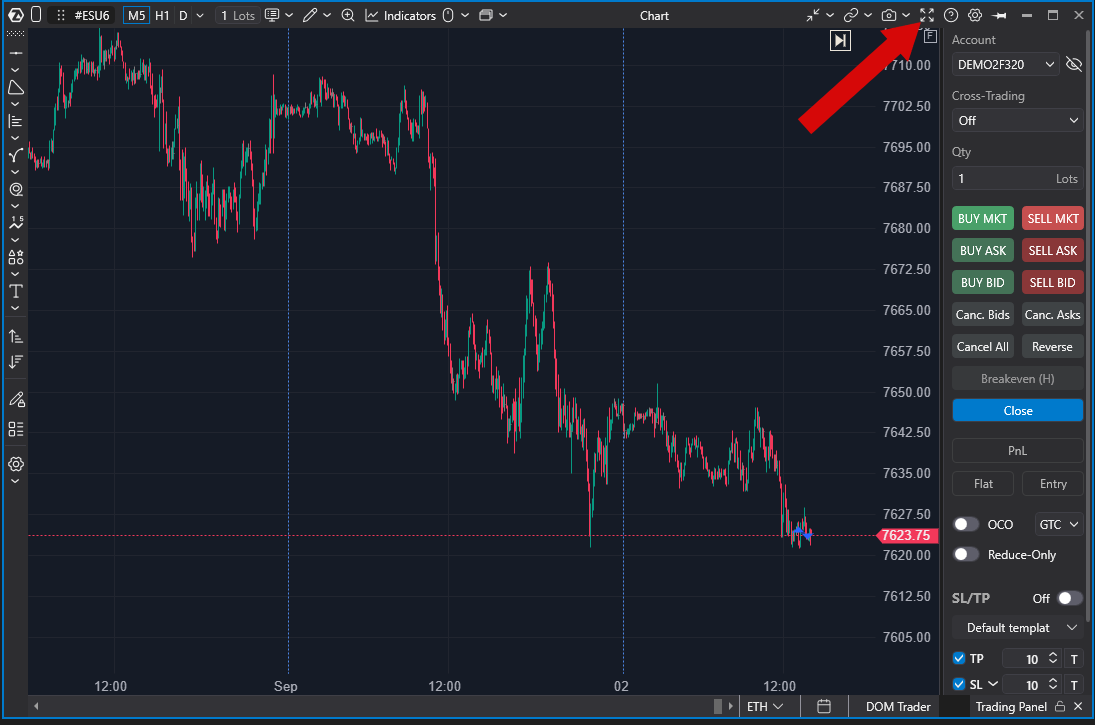
Full Screen
The Full Screen button expands the current chart to occupy the maximum available workspace area.
Use this mode when you need more space for chart analysis or when working with multiple indicators and drawing objects.
Summary
The chart toolbar provides quick access to the most frequently used chart functions. From a single toolbar you can:
- switch chart types and timeframes;
- change chart navigation and scaling;
- manage indicators, templates, and snapshots;
- add drawing objects;
- configure alerts and trading;
- open chart settings;
- navigate through historical data;
- work with linked windows;
- switch the chart to full-screen mode.
The available buttons may vary depending on your platform version
Was this article helpful?
That’s Great!
Thank you for your feedback
Sorry! We couldn't be helpful
Thank you for your feedback
Feedback sent
We appreciate your effort and will try to fix the article