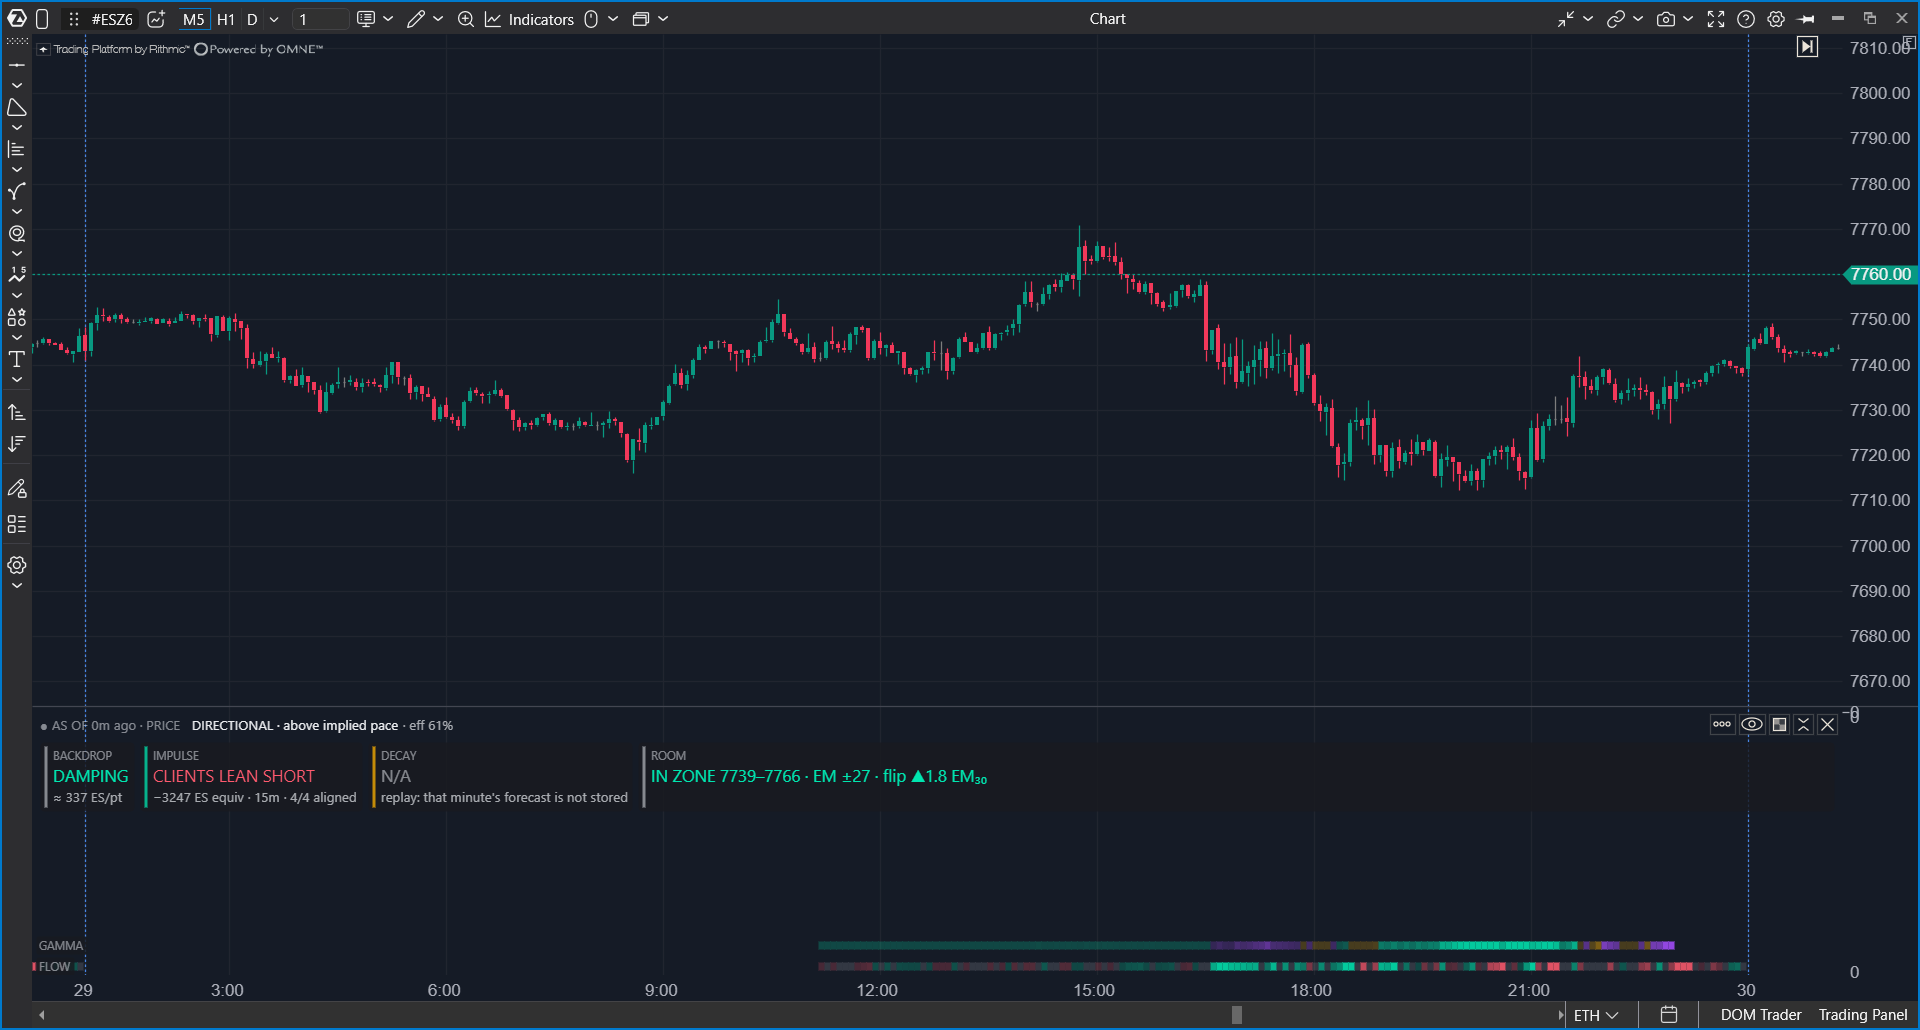
Options X-Ray: Market State brings the main conclusions from other Options X-Ray indicators into one panel below an ES, MES, SPY, or US 500 chart. It shows four short market conclusions, checks how price is actually moving, and adds two session-history strips.
You do not need to switch between several indicators to understand the current options context. The panel shows the whole picture at once and helps you see whether the conclusions agree with each other.
 Why Use It
Each Options X-Ray indicator answers a different question, with its own colors and scale. Market State summarizes the main questions in one panel.
| Conclusion | Question it answers |
| BACKDROP | Will price movement currently be damped or amplified? |
| IMPULSE | Which direction are market participants pushing right now? |
| DECAY | Which direction may time decay push price over the next 30 minutes? |
| ROOM | How much room does price have before the nearest damping levels? |
| PRICE | Is price actually moving directionally or rotating? |
There is no single combined score because market backdrop, participant pressure, and time decay are different forces. Combining them into one number would create false precision. Market State keeps each conclusion separate.
Market State is not a trading signal. It shows the environment in which you are trading. Make entry decisions using tape, clusters, and delta.
What You Should Know Before You Start
| Chart | Use an ES, MES, SPY, or US 500 chart. ES and MES work with any specific contract, for example ESZ5. The data is OptionsDepth analytics derived from CBOE market data for S&P 500 index (SPX) options. The panel is drawn below the chart. |
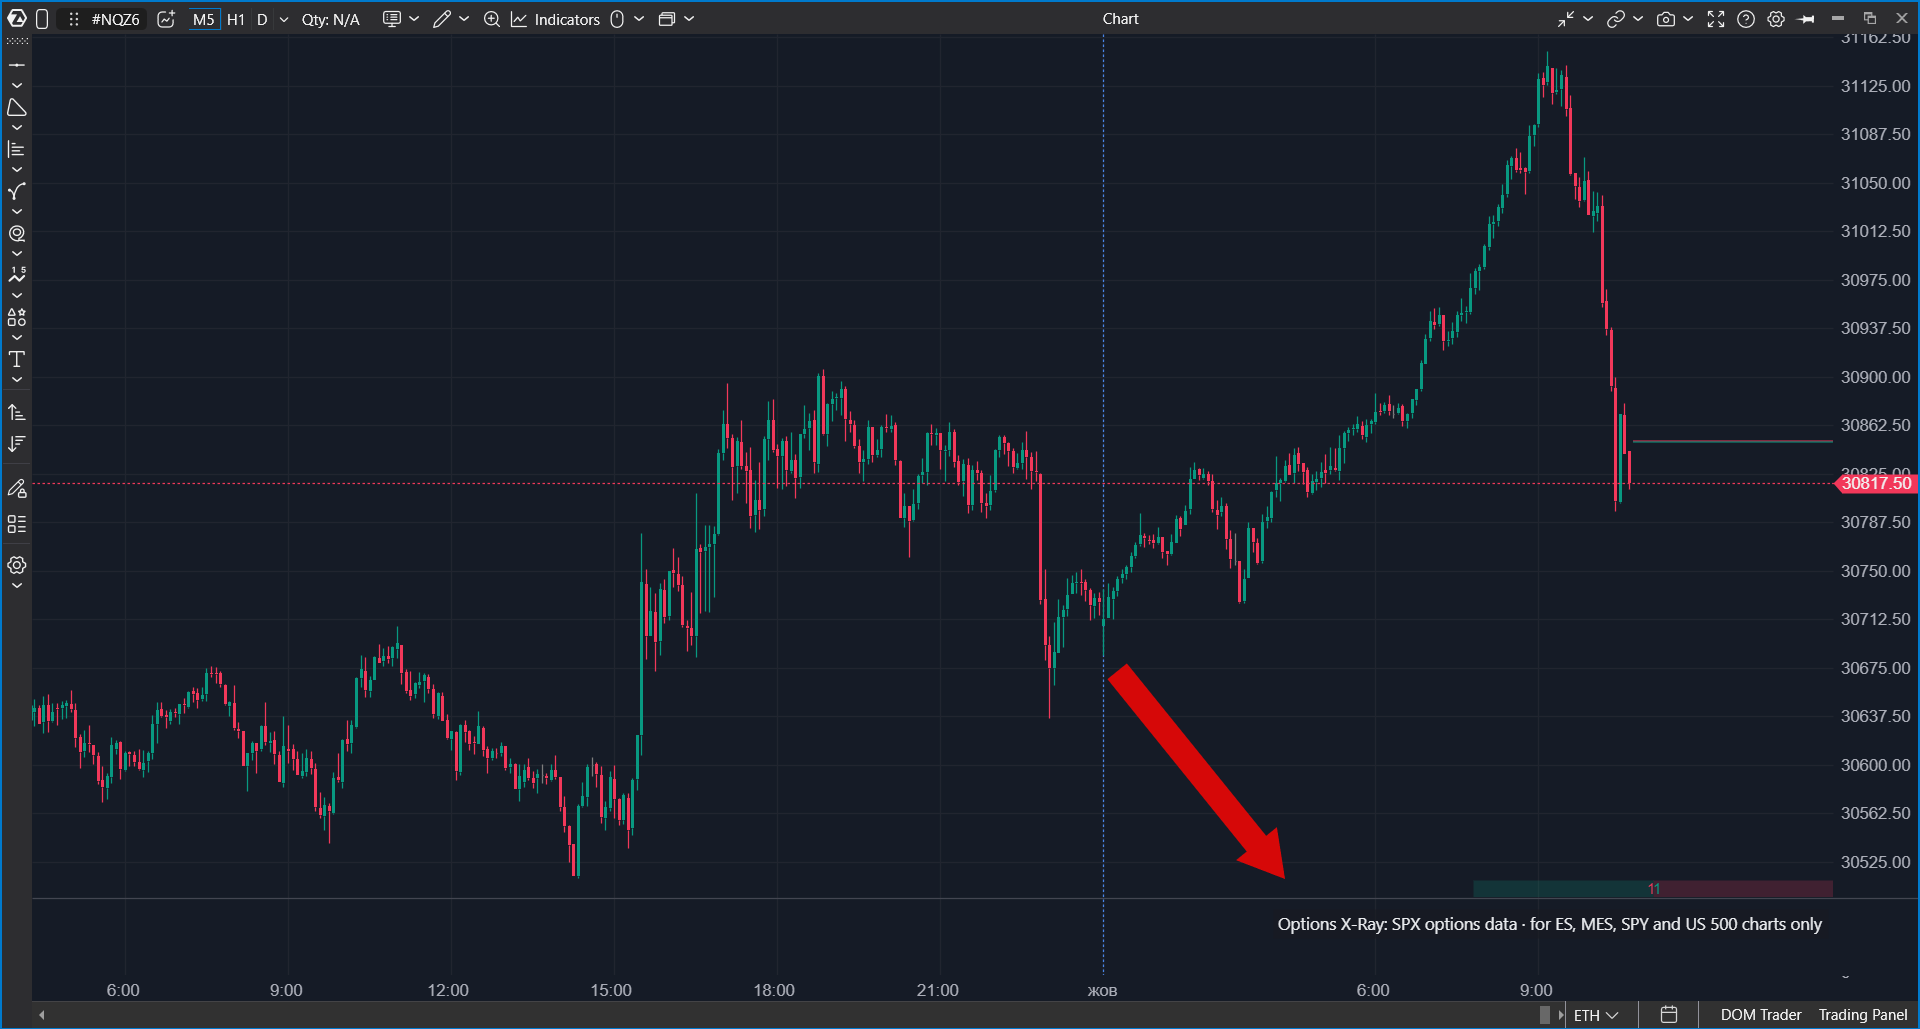
| Other markets | On any other instrument (NQ, oil, gold, individual stocks, crypto) the indicator draws nothing and shows an explanatory chip instead: Options X-Ray: SPX options data · for ES, MES, SPY and US 500 charts only. |
| Update frequency | The panel updates once per minute. |
| Panel size | The panel adapts to height. When it is low, numeric rows disappear first, then tiles compress into one row. Full explanations remain available in hover cards if Hover cards is set to On or While Ctrl is held. |
| Access | Options X-Ray indicators are part of a separate package. If the indicator is not in the list, check whether the package is enabled in your account. |
| Data | Built on minute-level SPX options positioning analytics derived from CBOE market data. Data & analytics by OptionsDepth. |
Panel Structure
| Part | What it contains |
| Top status line | Data freshness dot, how many minutes ago the latest data arrived, and the PRICE conclusion. |
| Tiles | Four conclusions from left to right: BACKDROP, IMPULSE, DECAY, and ROOM, with key numbers. |
| Bottom strips | GAMMA and FLOW history for the whole session, shown minute by minute. |
Confidence Labels
Each conclusion has a colored label that shows what it is based on.
| Label | Meaning |
| OBSERVED | Green. Based on something that has already happened: real trades or real price movement. |
| DERIVED | Gray. Calculated from current market positions. |
| CONDITIONAL | Amber. A forecast that is valid if positions and volatility do not change. |
BACKDROP: Market Background
BACKDROP shows how market makers may trade ES futures if price moves away from the current level: against the move, damping it, or with the move, amplifying it. This is the same core question as Options X-Ray: GEX Heatmap, compressed into one word.
| Conclusion | Meaning |
| DAMPING | Movement is damped both above and below price. Price may become sticky. |
| AMPLIFYING | Movement is amplified both above and below price. Moves are more likely to continue. |
| MIXED | One side is damping and the other is amplifying. The details show which side, for example upside amplifying. |
The number under the conclusion shows background strength: approximately how many ES contracts market makers may need to buy or sell per point of movement.
To avoid flickering, a new state must persist for three consecutive minutes, and at least five minutes must pass since the previous state change.
IMPULSE: Participant Pressure
IMPULSE shows which direction all participants together shifted positions during the last 15 minutes: retail traders, professionals, firms, and brokers, across all strikes and expiration dates.
| Conclusion | Meaning |
| CLIENTS LEAN LONG | Participants shifted positions toward upside exposure. |
| CLIENTS LEAN SHORT | Participants shifted positions toward downside exposure. |
| TWO-WAY | There is no clear direction. The hover card explains why. |
Two rules help avoid false conclusions: an imbalance below 50 ES contracts over 15 minutes is not treated as directional, and the last 5 minutes must agree with the 15-minute direction. If the flow has just reversed, the conclusion remains TWO-WAY.
Push and Cushion
The IMPULSE card compares pressure with what lies ahead.
| Card message | Meaning |
| Push is larger than cushion | Pressure may be strong enough to push through the damping zone ahead. |
| Push is smaller than cushion | Pressure may get stuck in the damping zone. |
| No cushion in its path | The background in the pressure direction is amplifying. There is no damping cushion, and market-maker hedging may go in the same direction. This is the most trend-friendly environment. |
DECAY: What Time May Bring
DECAY shows how many ES futures market makers may need to buy or sell over the next 30 minutes simply because time is passing. This is the same core question as Options X-Ray: Charm Heatmap. The calculation checks three scenarios: price is flat, price slowly rises, and price slowly falls.
| Conclusion | Meaning |
| DECAY BUYS | In all three scenarios, market makers are expected to buy. The tile shows a range, for example +12 to +40 ES over 30 minutes. |
| DECAY SELLS | In all three scenarios, market makers are expected to sell. |
| PATH-SENSITIVE | The direction depends on where price moves. |
| EXPIRY-SENSITIVE | Less than 45 minutes remain until expiration. The estimate is unreliable, so no values are shown. |
The DECAY label is always CONDITIONAL because it is a forecast, not an observation.
ROOM: Space Around Price
ROOM summarizes what is around the current price. A line can look like this:
IN ZONE 7798-7808 · EM +/-29 · flip up 0.9 EM30
| Part | Meaning |
| IN ZONE 7798-7808 | Price is inside a zone where movement is damped. If price is outside a zone, the line shows the nearest edge of the nearest damping zone. |
| EM +/-29 | Expected move: how far the options market estimates price may move. |
| flip up 0.9 EM30 | The boundary where the background changes from damping to amplifying, or the opposite. The arrow shows whether it is above or below price. The number is the distance in typical 30-minute moves. |
No zones is also a conclusion. Only zones that price can realistically reach before the close are shown. If none are shown, there may be no damping zones in price's path before the close.
PRICE: Price Confirmation
PRICE is the only conclusion that does not use options data. It looks at candles on your chart over the last 30 minutes: how far price traveled in total and how far it moved by the end.
| Conclusion | Meaning |
| DIRECTIONAL | Price is moving in one direction. The final displacement is more than 55% of the total traveled path. |
| ROTATIONAL | Price is chopping. The final displacement is less than 45% of the total path. |
When displacement is between 45% and 55%, the conclusion does not change.
| BACKDROP + PRICE | Meaning |
| AMPLIFYING + DIRECTIONAL | The picture agrees: the move is real. |
| DAMPING + ROTATIONAL | The picture agrees: a normal choppy day. |
| DAMPING + DIRECTIONAL | Pressure is pushing through a damping background. |
| AMPLIFYING + ROTATIONAL | The conditions for a sharp move exist, but nobody has started it yet. |
History Strips
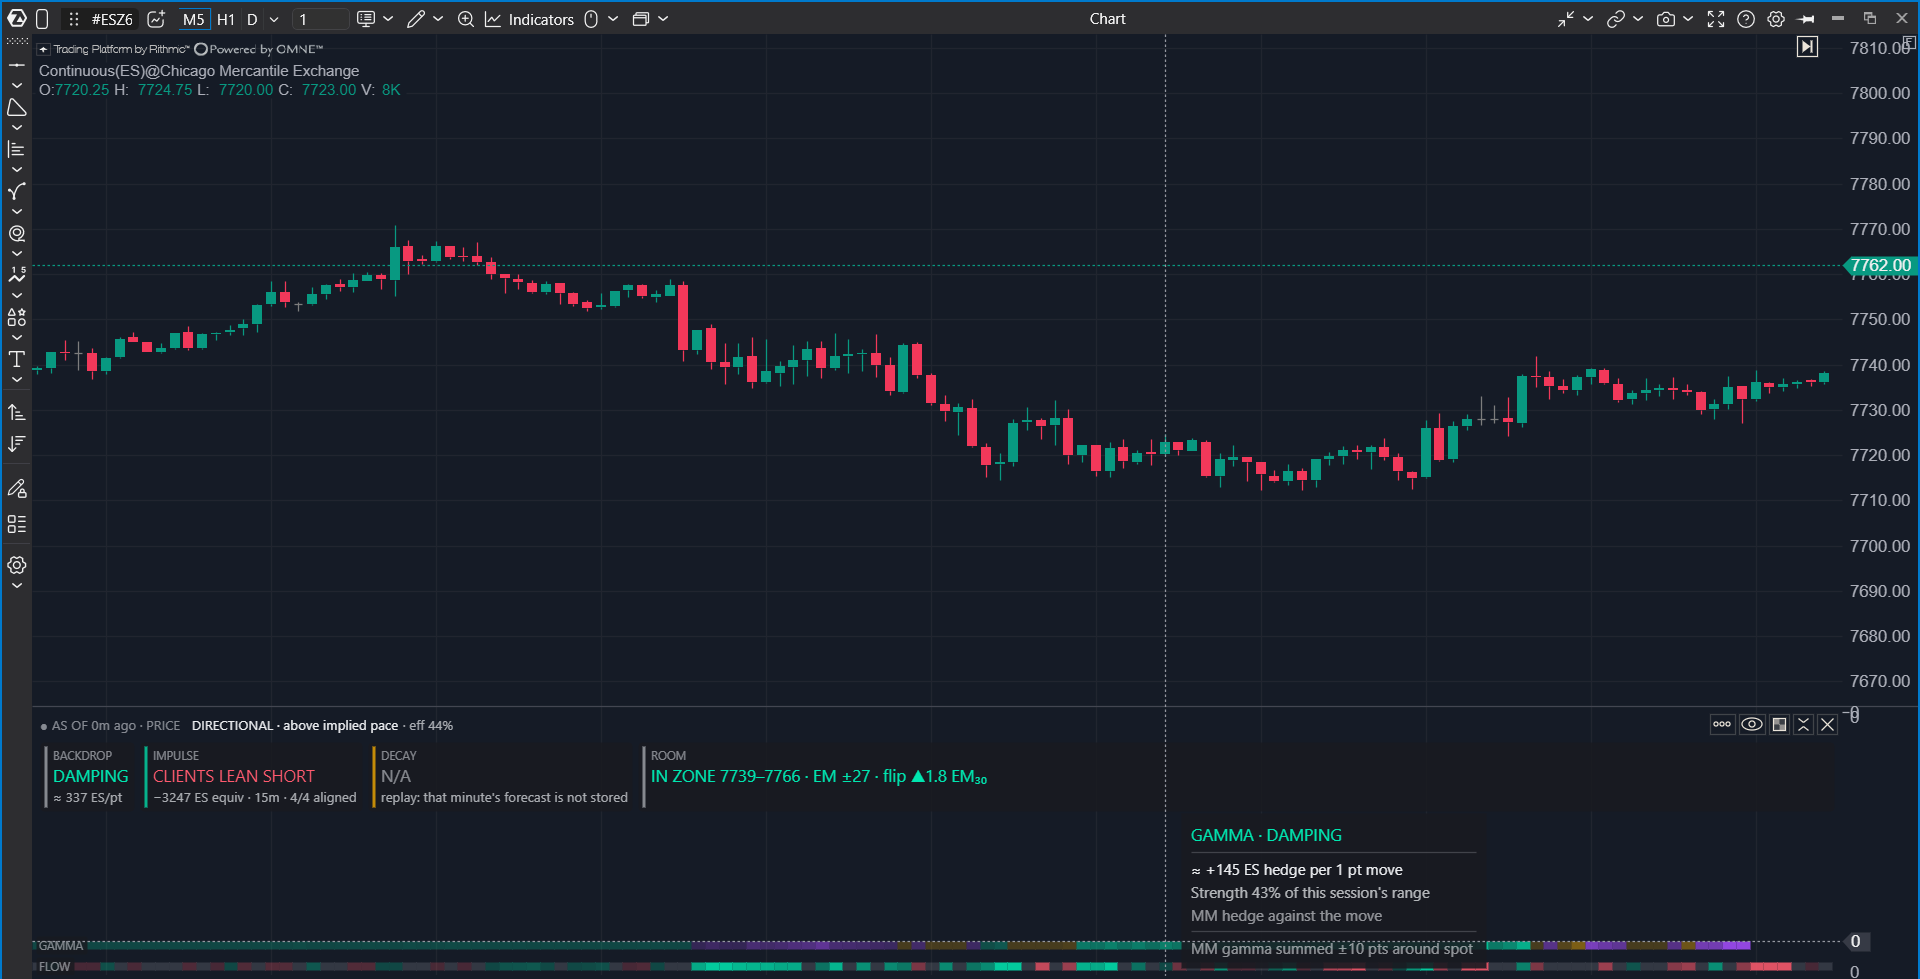
The tiles show what is happening now. The two strips at the bottom show similar information for the whole session minute by minute.
| Strip | Colors |
| GAMMA | Mint means movement is damped, purple means movement is amplified, and amber means mixed background. |
| FLOW | Mint means participants shifted toward upside exposure, coral means they shifted toward downside exposure, and gray means no clear direction. |
Brightness shows strength. The scale is separate for each session: a bright spot means strong for this day. Hover over any point on a strip to see the values for that minute.
 How to Add the Indicator
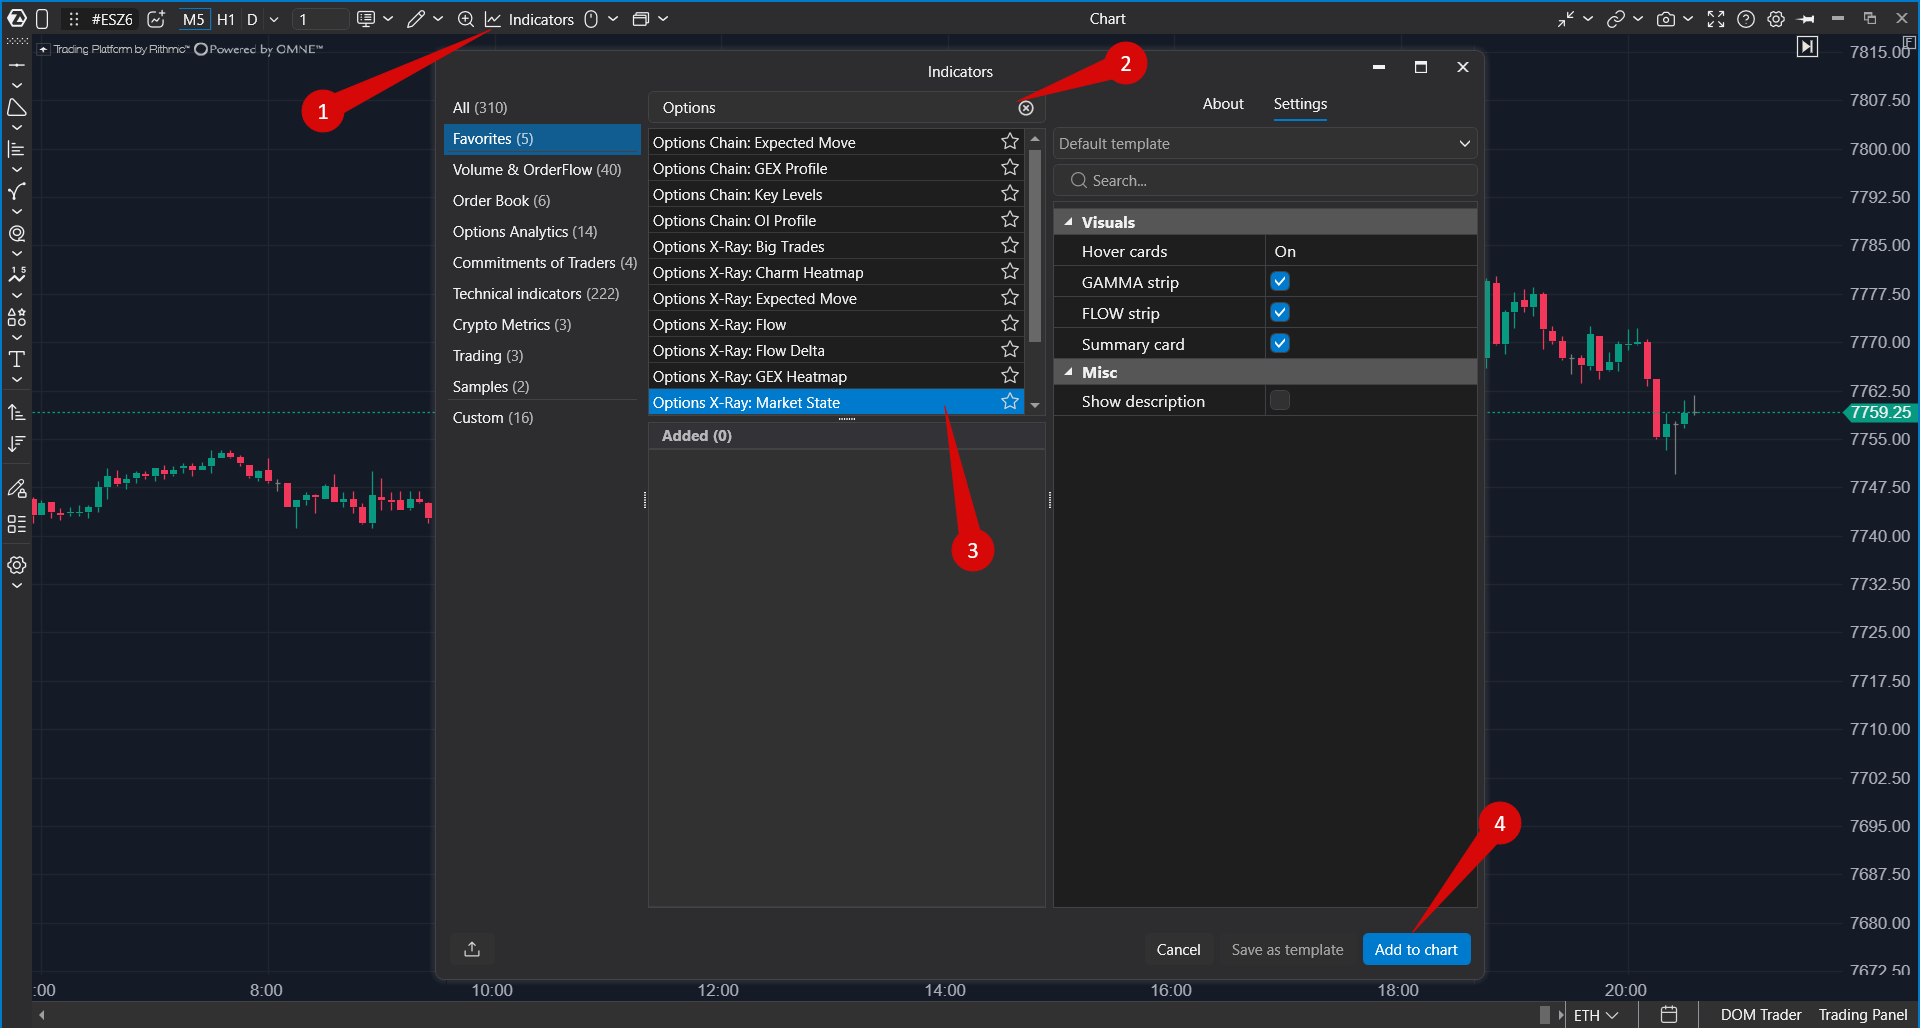
- Open an ES, MES, SPY, or US 500 chart.
- Click Indicators on the top panel.
- Select the Options Analytics group or type Options in search.
- Select Options X-Ray: Market State.
- Click Add to chart.
 The panel opens below the chart. Increase its height if you want to see numbers on the tiles.
Settings
| Setting | What it does |
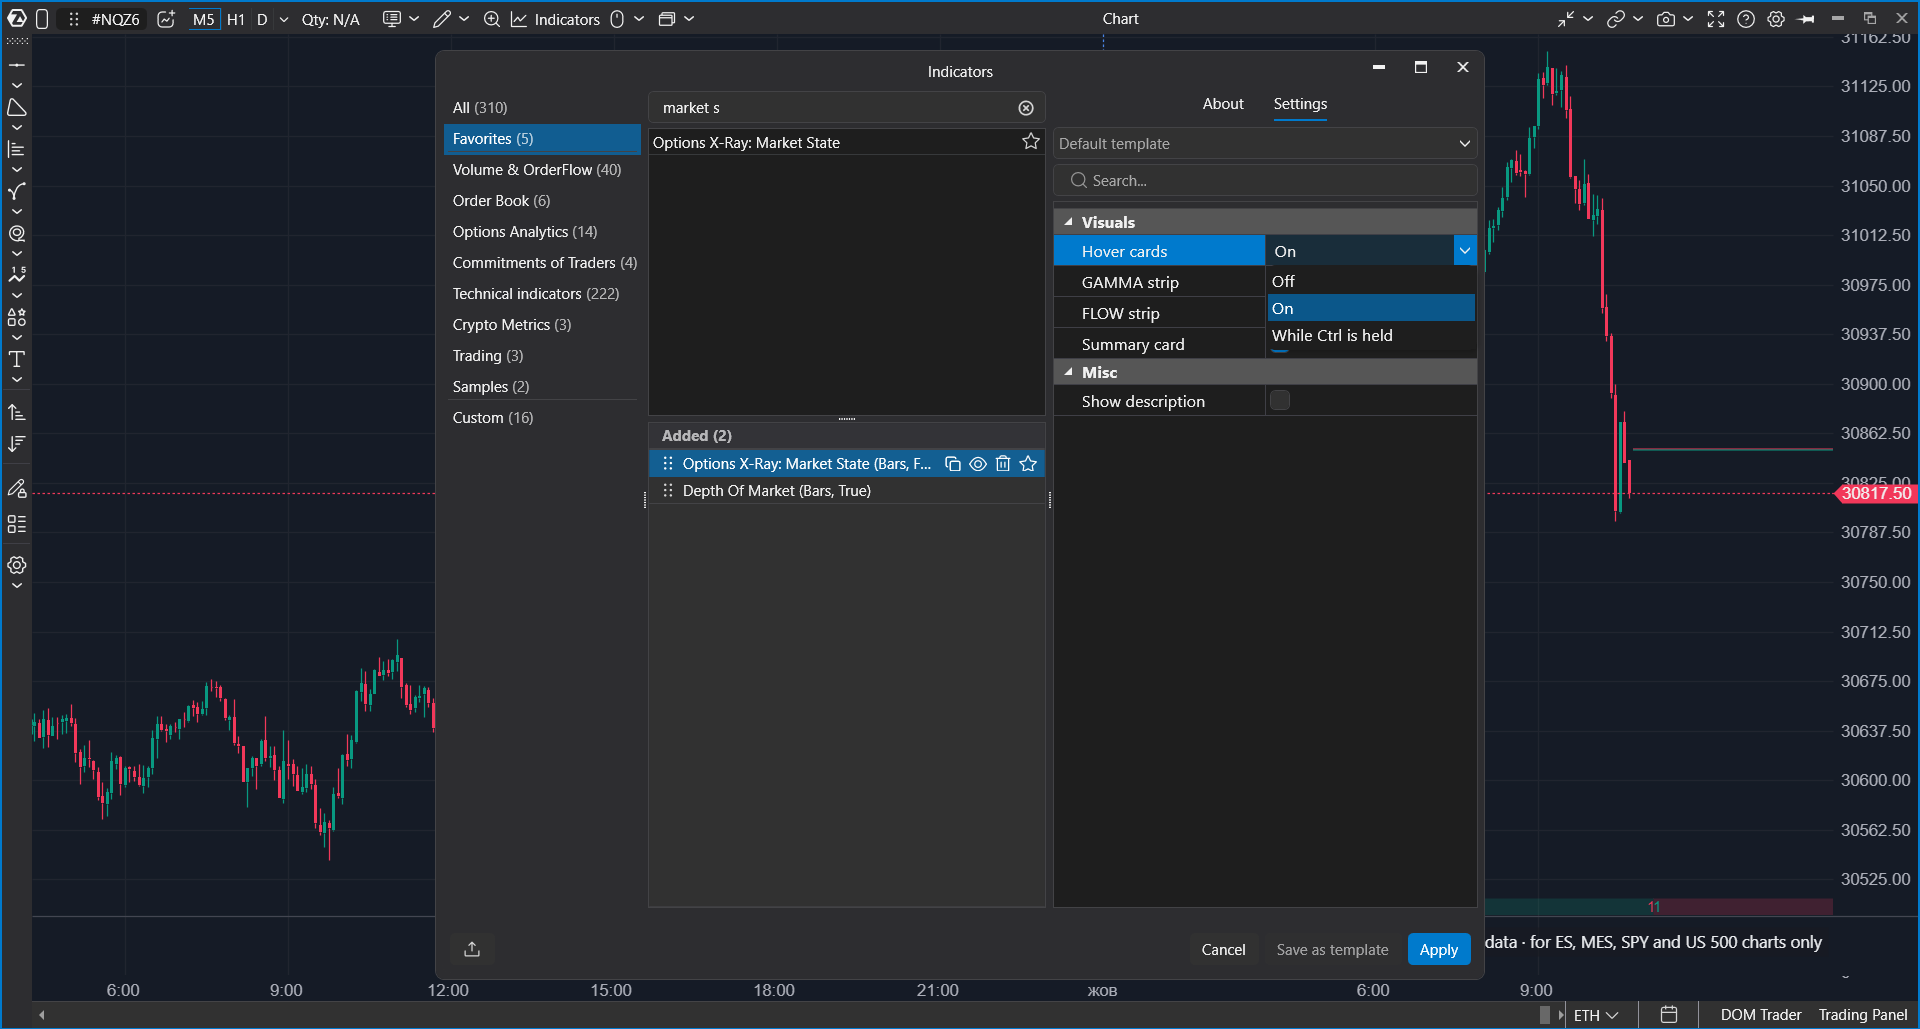
| Hover cards | Controls the explanatory hover cards: Off, On (default), or While Ctrl is held. The Ctrl mode keeps the panel clean and shows the card only on demand. |
| GAMMA strip | Shows the market-background history strip. Enabled by default. |
| FLOW strip | Shows the participant-pressure history strip. Enabled by default. |
| Summary card | Shows the conclusion tiles. Enabled by default. |
| Show description | Shows a short indicator description on the panel. Disabled by default. |
If the panel takes too much space, disable one or both history strips.
How to Work With the Indicator
- Check the freshness dot in the status line.
- Read BACKDROP: will movement currently be damped or amplified?
- Compare PRICE with BACKDROP: is price behaving the way the options background suggests?
- Read IMPULSE: where are participants pushing, and is the push strong enough to get through the damping area?
- Read ROOM: how much room price has before the nearest zone and before a background flip.
- Read DECAY: whether time decay may help or resist over the next 30 minutes.
- Open detailed indicators when needed: GEX Heatmap, Charm Heatmap, Flow Delta, or Big Trades.
Troubleshooting
| What happens | What to do |
| The indicator is not in the list | Check whether the Options X-Ray package is enabled in your account. |
| The panel is empty, and the chart shows the chip "Options X-Ray: SPX options data · for ES, MES, SPY and US 500 charts only" | The chart instrument is not supported. Open an ES, MES, SPY, or US 500 chart. |
| The panel is empty on a supported chart | During weekends and holidays there is no new data, but previous sessions should still be displayed. |
| There are no numbers on the tiles | The panel is not high enough. Increase its height. |
| The status dot is yellow | The latest data arrived with a delay. Wait for the next update. |
| A strip segment is empty | There were no fresh data for more than 10 minutes. The indicator does not draw stale data. |
| A tile shows N/A | The conclusion cannot be calculated for that minute. Hover over the tile to see the reason. |
| Hover cards do not appear | Check the Hover cards setting. If it is set to While Ctrl is held, hold Ctrl while hovering. |
| DECAY shows EXPIRY-SENSITIVE without numbers | Less than 45 minutes remain until expiration, so the estimate is unreliable. This is expected. |
| IMPULSE shows TWO-WAY while Flow Delta looks directional | IMPULSE includes all participants and all expirations, while Flow Delta defaults to Retail and Pros and 0DTE. IMPULSE also checks 15 minutes and requires the last 5 minutes to agree. If flow has just reversed or the imbalance is below 50 ES contracts, the conclusion remains TWO-WAY. |
Was this article helpful?
That’s Great!
Thank you for your feedback
Sorry! We couldn't be helpful
Thank you for your feedback
Feedback sent
We appreciate your effort and will try to fix the article