Liquidity Pressure (DOM Pressure) — visual analysis of order book strength
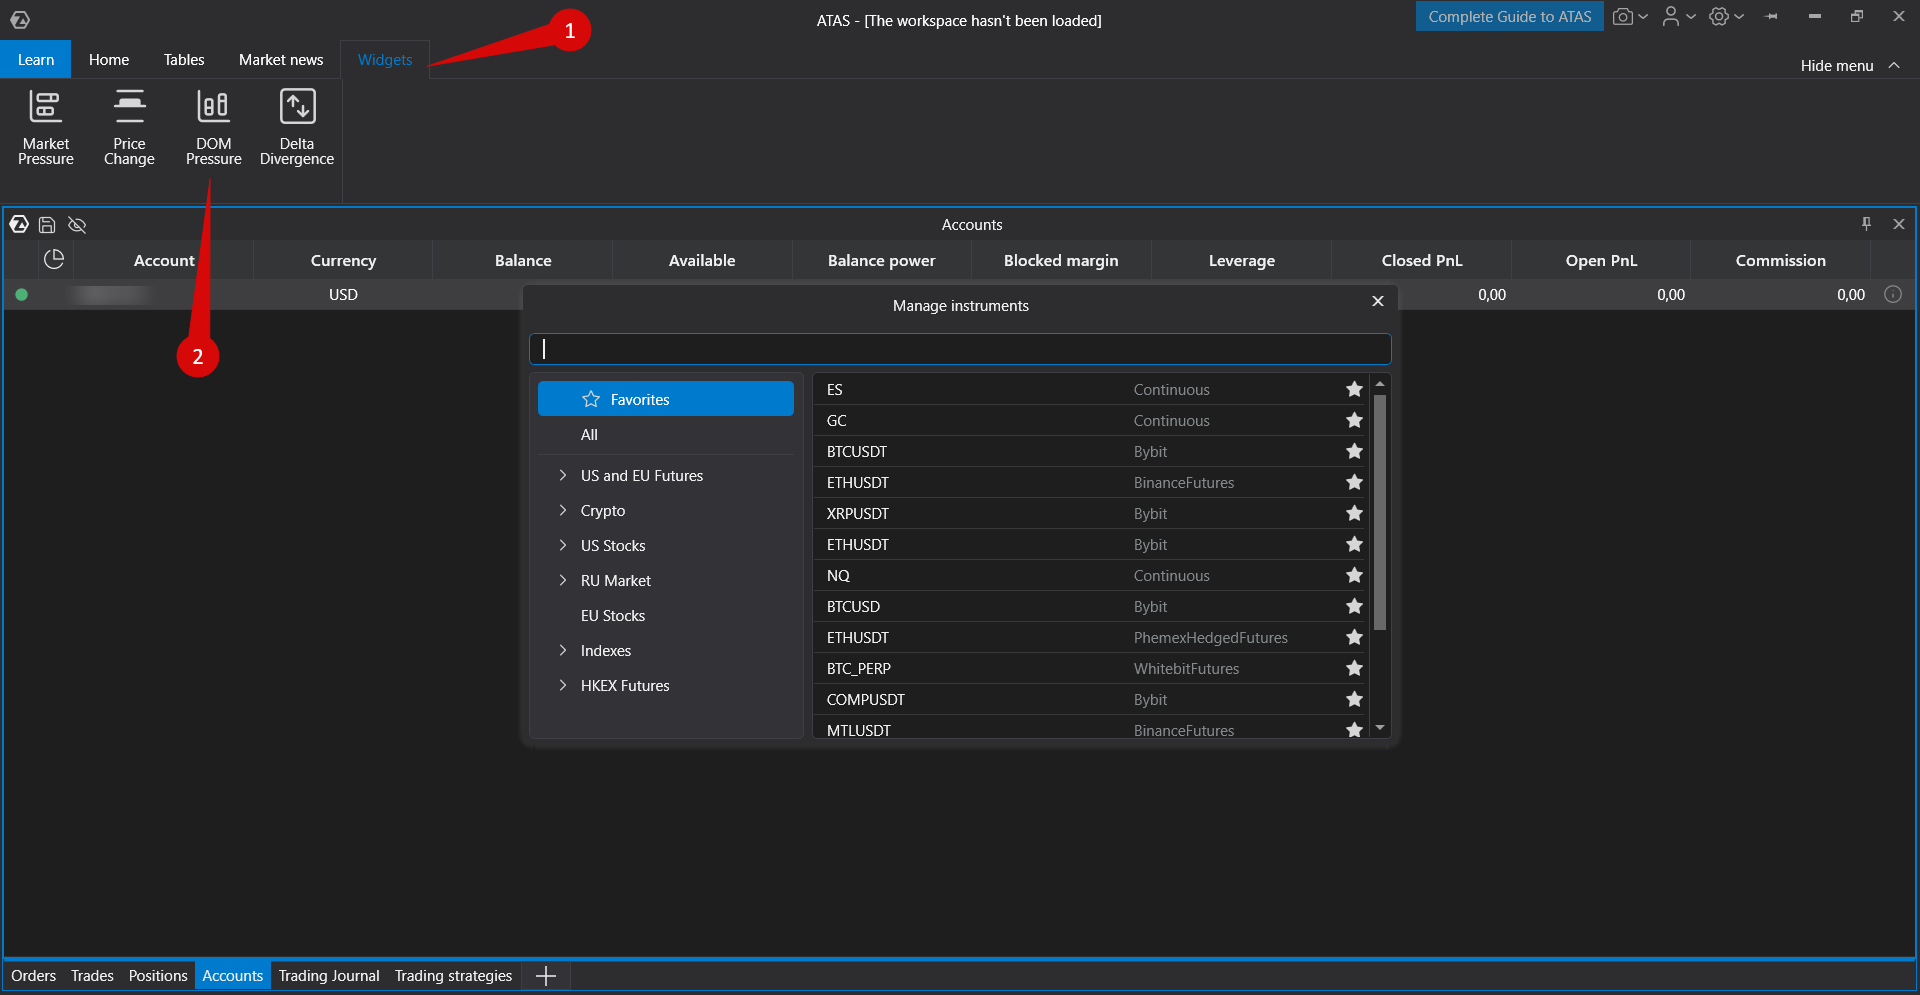
To open this widget, select Widgets → DOM Pressure.
The Liquidity Pressure widget provides traders with a visual representation of buyer and seller strength based on weighted liquidity analysis of the order book (DOM).
This tool helps assess the real balance of power between buyers and sellers in real time.
Principle of Operation
Calculation of Buyer and Seller Strength
The widget analyzes order book data and calculates weighted liquidity for both sides.
Bid Liquidity (Buyer Strength):
All buy orders in the order book are summed.
Each order is multiplied by a weight based on its distance from the best bid/ask.
Orders closer to the market receive a higher weight.
The final value represents the total strength of buyers.
Ask Liquidity (Seller Strength):
Calculated using the same method for sell orders.
Represents the total strength of sellers.
Calculation Formula:
Weighted Liquidity = Σ(Order Volume × e^(-Level Number / Weight Decay))
Exponential Decay Principle (Weight Decay)
The Weight Decay parameter determines how quickly the influence of orders decreases as they move further away from the market.
Low values (1–3): near-market orders have maximum weight, while distant orders are almost ignored.
Useful for short-term pressure analysis and immediate execution readiness.
Medium values (4–10): provide a balanced view of both near and distant levels.
Useful for evaluating overall liquidity distribution.
High values (11–20): all levels are considered more evenly.
Useful for analyzing overall market depth, including large distant orders.
Example (Weight Decay = 3):
Level 1: ≈100% weight
Level 2: ≈51%
Level 3: ≈37%
Level 5: ≈19%
Level 10: ≈4%
Training Period
When the widget is launched or when the instrument changes, a training period begins.
What Happens During Training
The widget collects liquidity data over the selected period (default: 1 minute).
Tracks the maximum Bid and Ask liquidity values.
These maximum values are used to normalize current values as percentages (0–100%).
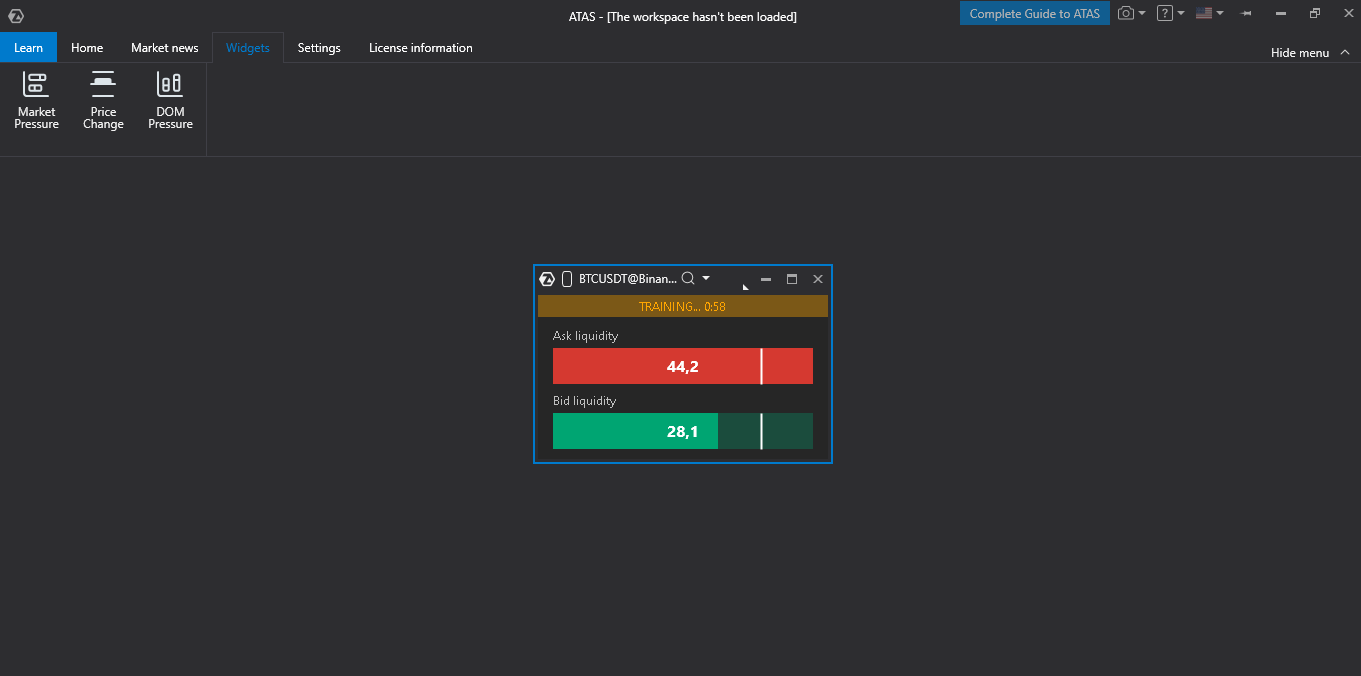
Visual Indication
An orange bar labeled TRAINING... M:SS appears at the top of the widget.
Displays the countdown until training is complete.
Data is visible during training, but sound alerts are disabled.
Purpose of the Training Phase
Adapts the widget to current market conditions.
Automatically calibrates bar scaling for accurate visualization.
Determines typical liquidity levels for each instrument.
After training, displayed values show how current liquidity compares to normal market conditions.
Sliding Window
After training, the widget continues tracking maximum values in a sliding window.
If market conditions change, maximum values are updated automatically.
This ensures that normalization remains accurate throughout the trading session.
Main Functionality
Visualization
Three display modes are available:
Horizontal — horizontal bars for Bid and Ask liquidity.
Vertical — vertical bars displayed side by side.
Center — bars grow outward from the center in opposite directions.
Each mode displays:
Colored liquidity bars (green for Bid, red for Ask).
Numeric weighted liquidity values.
A threshold line for visual evaluation of excessive levels.
A TRAINING... indicator with a countdown during the training phase.
Bars normalized on a unified scale, allowing direct comparison of buyer and seller strength.
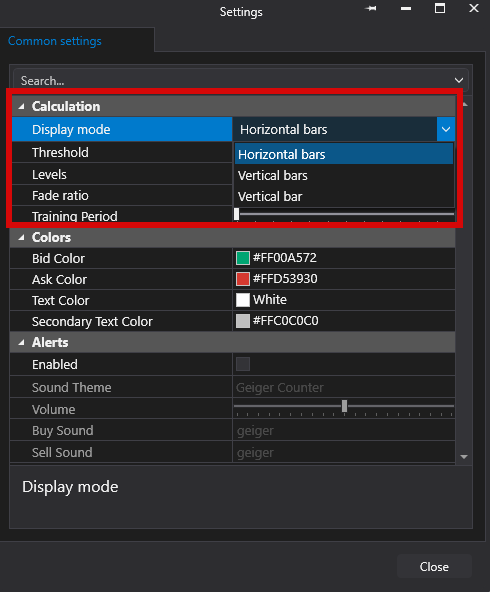
Calculation Settings
Display Mode — visualization type (Horizontal, Vertical, or Center).
Threshold — threshold value in % (default: 80%). Sound alerts are triggered when exceeded.
Levels — number of order book levels analyzed (5–50, default: 10).
Weight Decay — exponential decay factor (1–20, default: 3). Lower values emphasize near-market liquidity.
Training Period — training duration in minutes (1–60, default: 5).
Sound Alerts

Enable or disable sound alerts.
Select a sound theme (Geiger Counter, Custom, or Custom Pitch).
Adjust sound volume.
Use separate sound files for Bid and Ask pressure alerts.
Alerts are triggered when liquidity exceeds the configured threshold.
No sound is played during the training period.
Color Scheme

Customize colors for:
Bid Liquidity (default: green)
Ask Liquidity (default: red)
Primary Text
Secondary Text (Labels)
Trading Applications
The Liquidity Pressure widget helps traders:
Identify demand and supply imbalances in the order book.
Detect zones of concentrated liquidity.
Recognize aggressive buyers or sellers through rising pressure.
Make entry and exit decisions based on order book pressure.
Receive sound alerts when significant pressure changes occur.
Assess overall market depth and the positioning of large orders relative to the best bid and ask.
Was this article helpful?
That’s Great!
Thank you for your feedback
Sorry! We couldn't be helpful
Thank you for your feedback
Feedback sent
We appreciate your effort and will try to fix the article