Chart Display Modes
ATAS supports multiple chart display modes. By default, charts are opened in Candles mode, but you can switch between different display types at any time.
To change the chart display mode, use one of the following methods:
- Click the chart type icon on the chart toolbar and select the desired mode.
- Right-click anywhere on the chart and select the required display mode from the context menu.
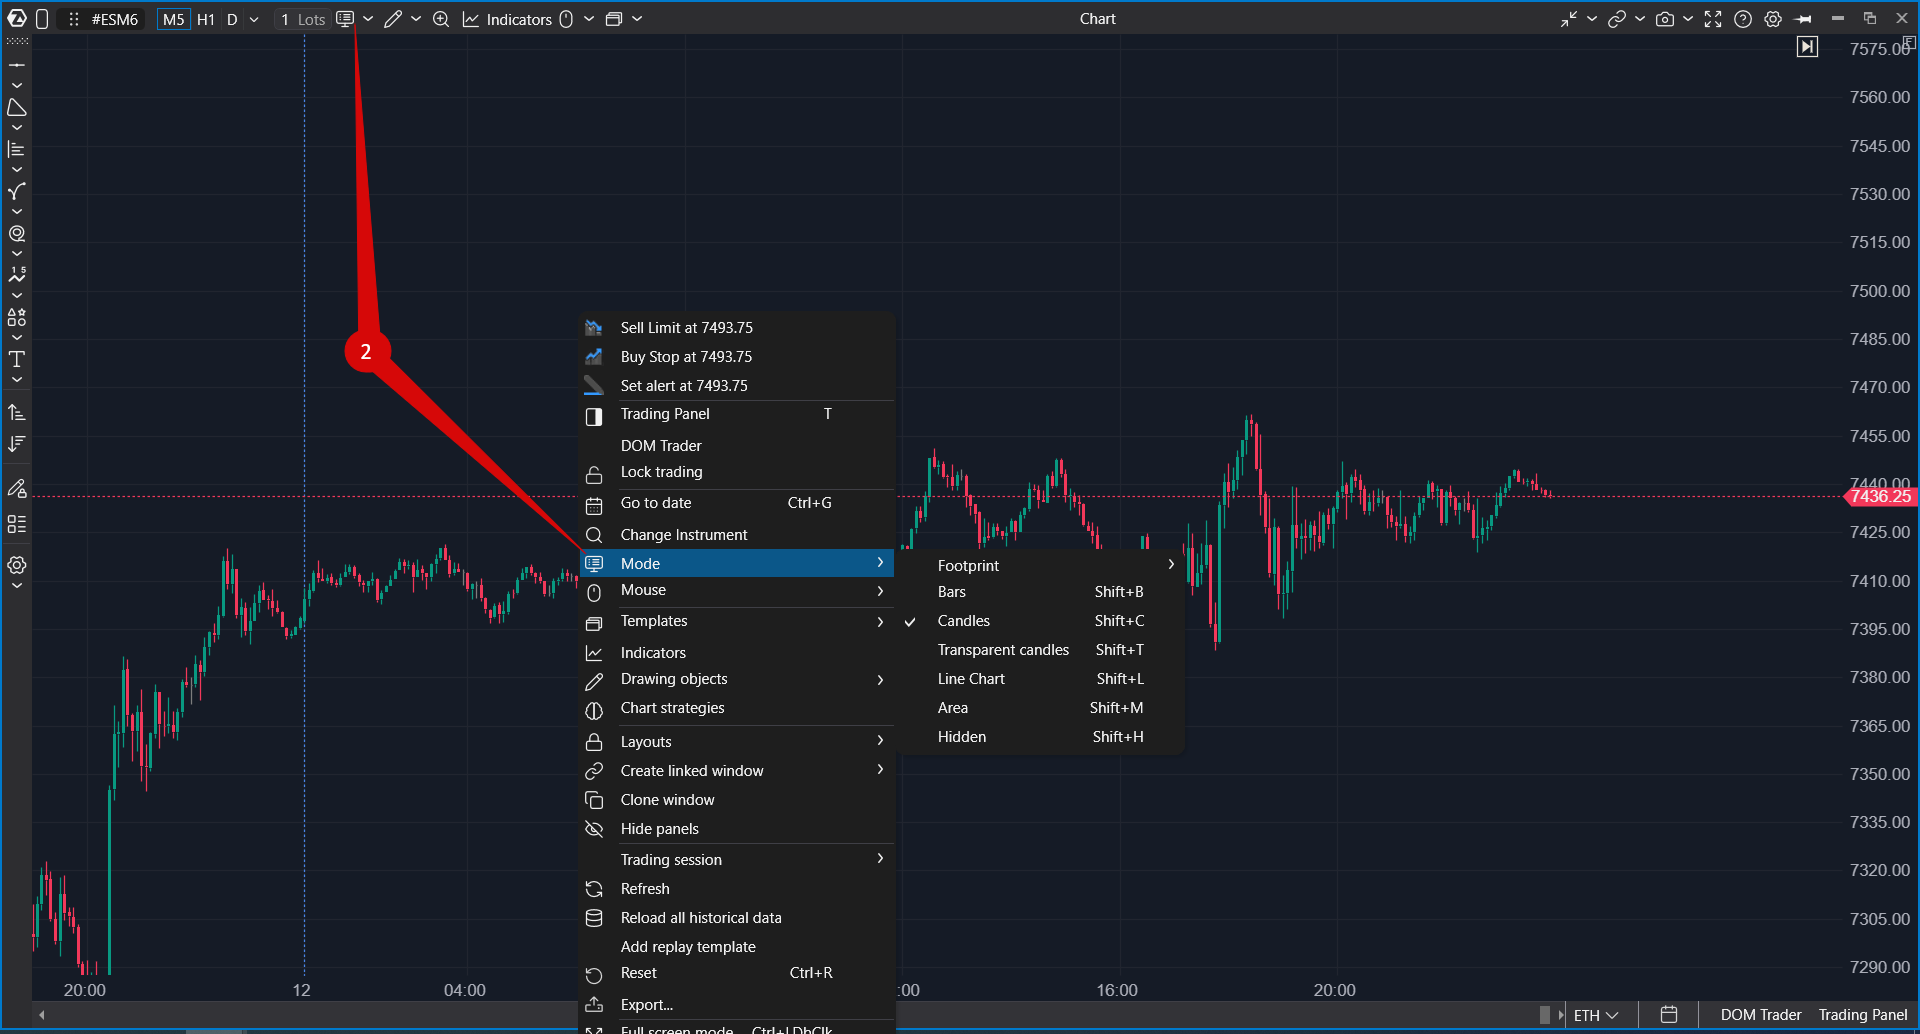
The following chart display modes are available:
Bars
Bars are a standard chart type used in classical technical analysis. They are built using four values: Open, High, Low, and Close (OHLC). Bars and candles contain the same information but differ in appearance.

Candles
Candles are the default chart type in ATAS. Like bars, they display Open, High, Low, and Close values, but use a candle body for easier visual interpretation of price movement.

Transparent Candles
Transparent Candles display candle outlines with transparent bodies. This mode is useful when multiple indicators and drawing objects are applied to the chart, helping reduce visual clutter.

Line Chart
Line Chart displays only the closing prices of each bar and connects them with a continuous line. This view is useful for identifying long-term trends while minimizing chart complexity.

Area
Area is a variation of the Line Chart where the area beneath the line is filled.

Hidden
Hidden mode hides the chart display while keeping other chart elements and indicators visible.

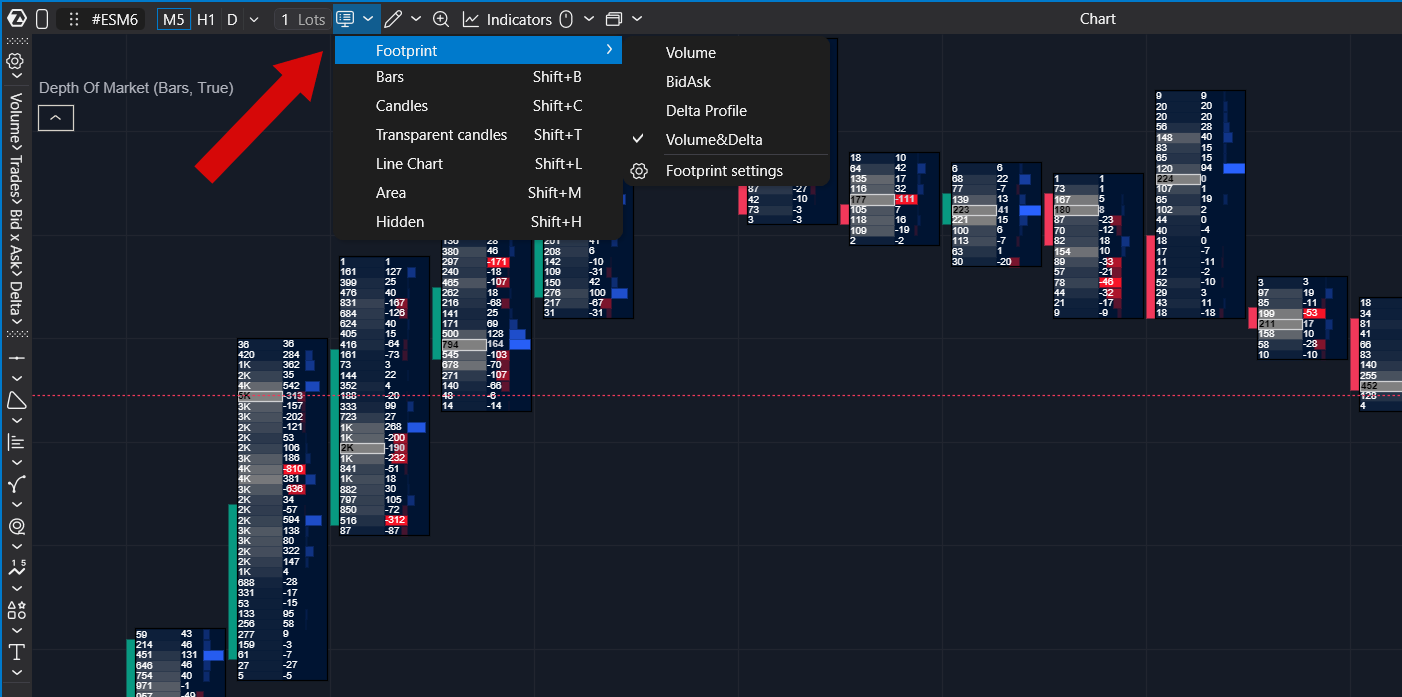
Footprint
Footprint charts display executed buy and sell volume at each price level within a bar. This chart type provides detailed order flow information and is one of the core analytical tools available in ATAS.
When Footprint mode is enabled, an additional toolbar appears on the left side of the chart, providing cluster display options.
Available Footprint display modes include:
- Volume
- Delta Profile
- Bid × Ask
- Volume & Delta
For detailed information about Footprint configuration, see the Footprint Settings article.
Automatic Transformation of Footprints to Candles
When the chart is zoomed out, Footprint charts automatically switch to Candles mode. This behavior can be disabled.
To disable automatic transformation:
- Click the chart Settings button.
- Open the Visual Settings tab.
- In the Other section, clear the Auto Transform Candles to Clusters option.

Related article: Footprint Settings.
Was this article helpful?
That’s Great!
Thank you for your feedback
Sorry! We couldn't be helpful
Thank you for your feedback
Feedback sent
We appreciate your effort and will try to fix the article