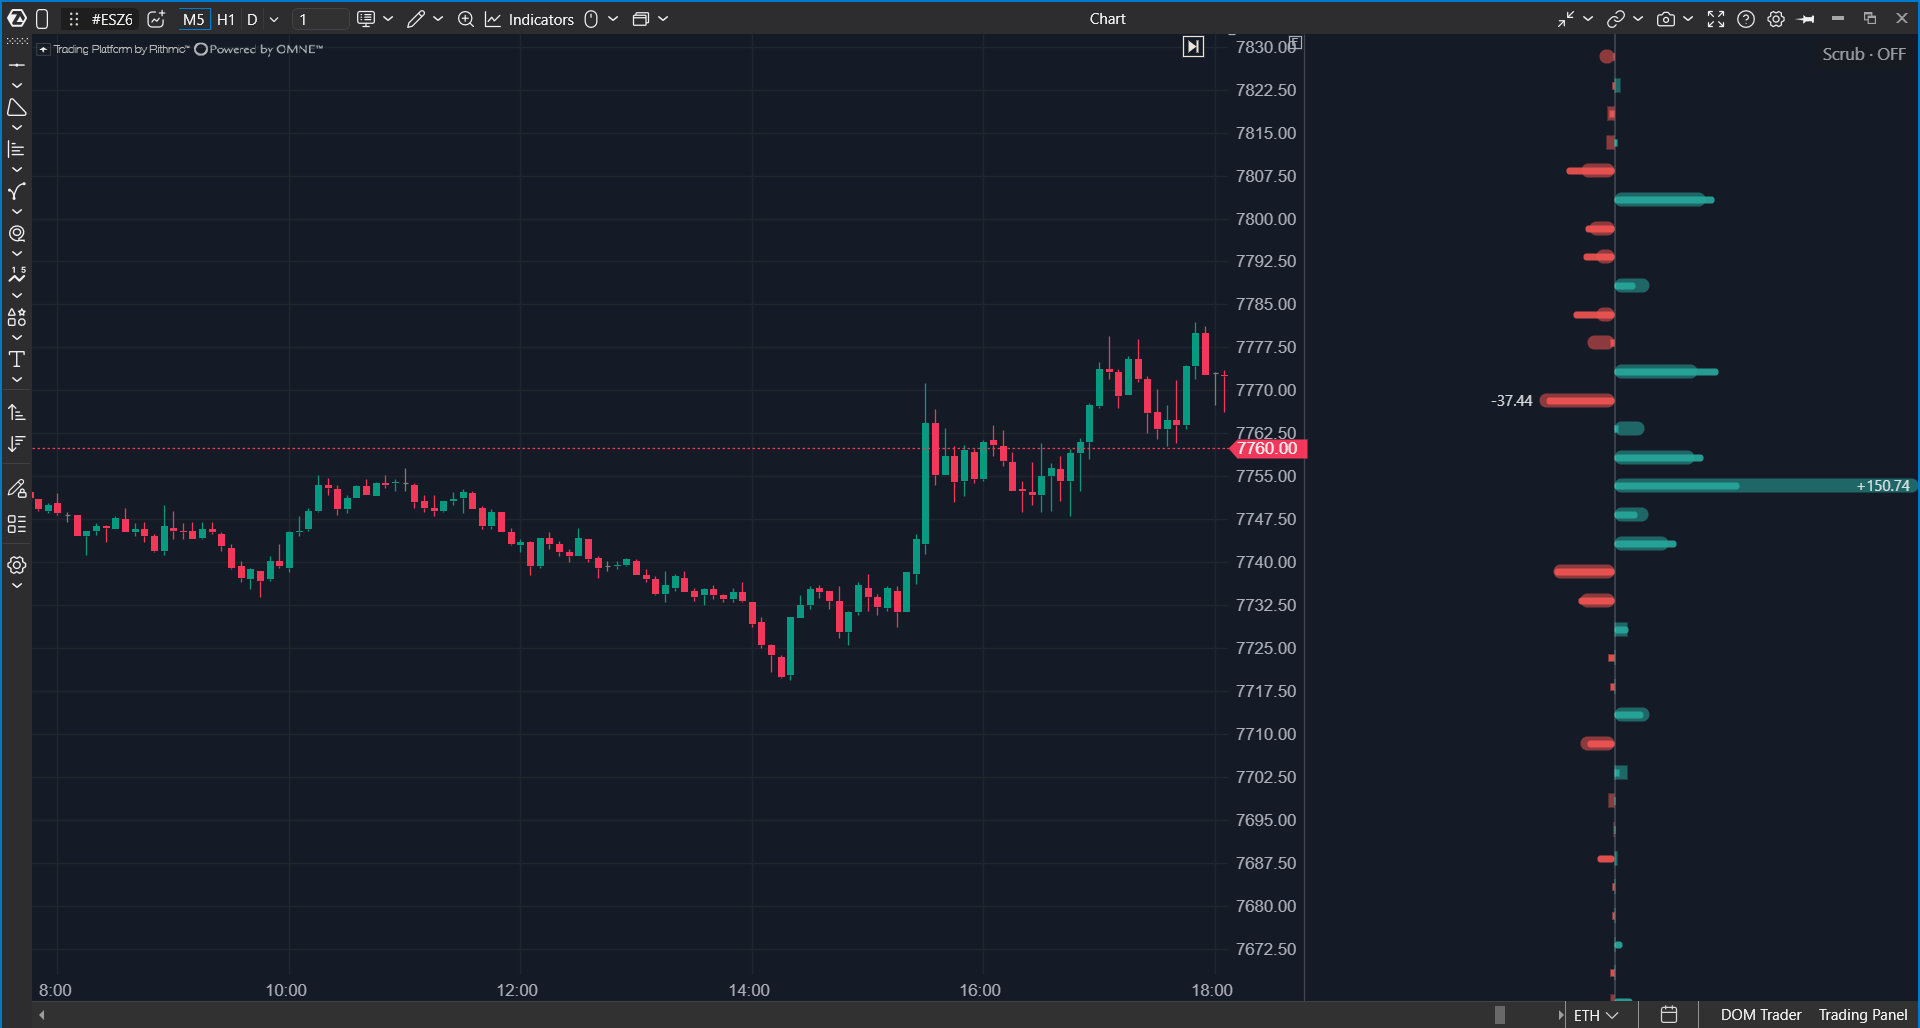
Options X-Ray: Strike Profile (GEX/DEX/VEX/CEX) draws a strike-by-strike profile next to an ES, MES, SPY, or US 500 chart — by default in its own panel next to the candles. It shows how much risk stands at each level and who holds it. The profile updates every minute and can be reviewed for any moment of the day by moving the cursor across the chart. The multi-session layouts also show how positioning was built day by day.
You can see what the options market looked like at 10:00 or just before yesterday's sharp move.
 Why Use It
The profile answers the question: where are the large positions, and whose positions are they? What it shows depends on the Positioning setting.
| Mode | What it shows | Questions it answers |
| Market makers | Where market-maker hedging may damp or amplify price movement at each strike. Gamma is the default. You can also choose delta, vanna, or charm. | Where are the walls where price may become sticky? Where are the levels after which movement may accelerate? |
| Participant group | The position of retail traders, professionals, firms, or brokers at each strike. | At which levels do firms hold large positions? Are they building or reducing them today? |
The main difference from regular profiles is time. The profile is linked not only to the current moment, but also to any historical bar. You can answer questions such as what the picture looked like in the morning or what stood at a level before a breakout.
Strike Profile is not a trading signal. It shows where positions stand. Confirm entries with tape, clusters, and delta.
What You Should Know Before You Start
| Chart | Use an ES, MES, SPY, or US 500 chart. ES and MES work with any specific contract, for example ESZ5. The data is OptionsDepth analytics derived from CBOE market data for S&P 500 index (SPX) options, and it is mapped to the chart automatically. |
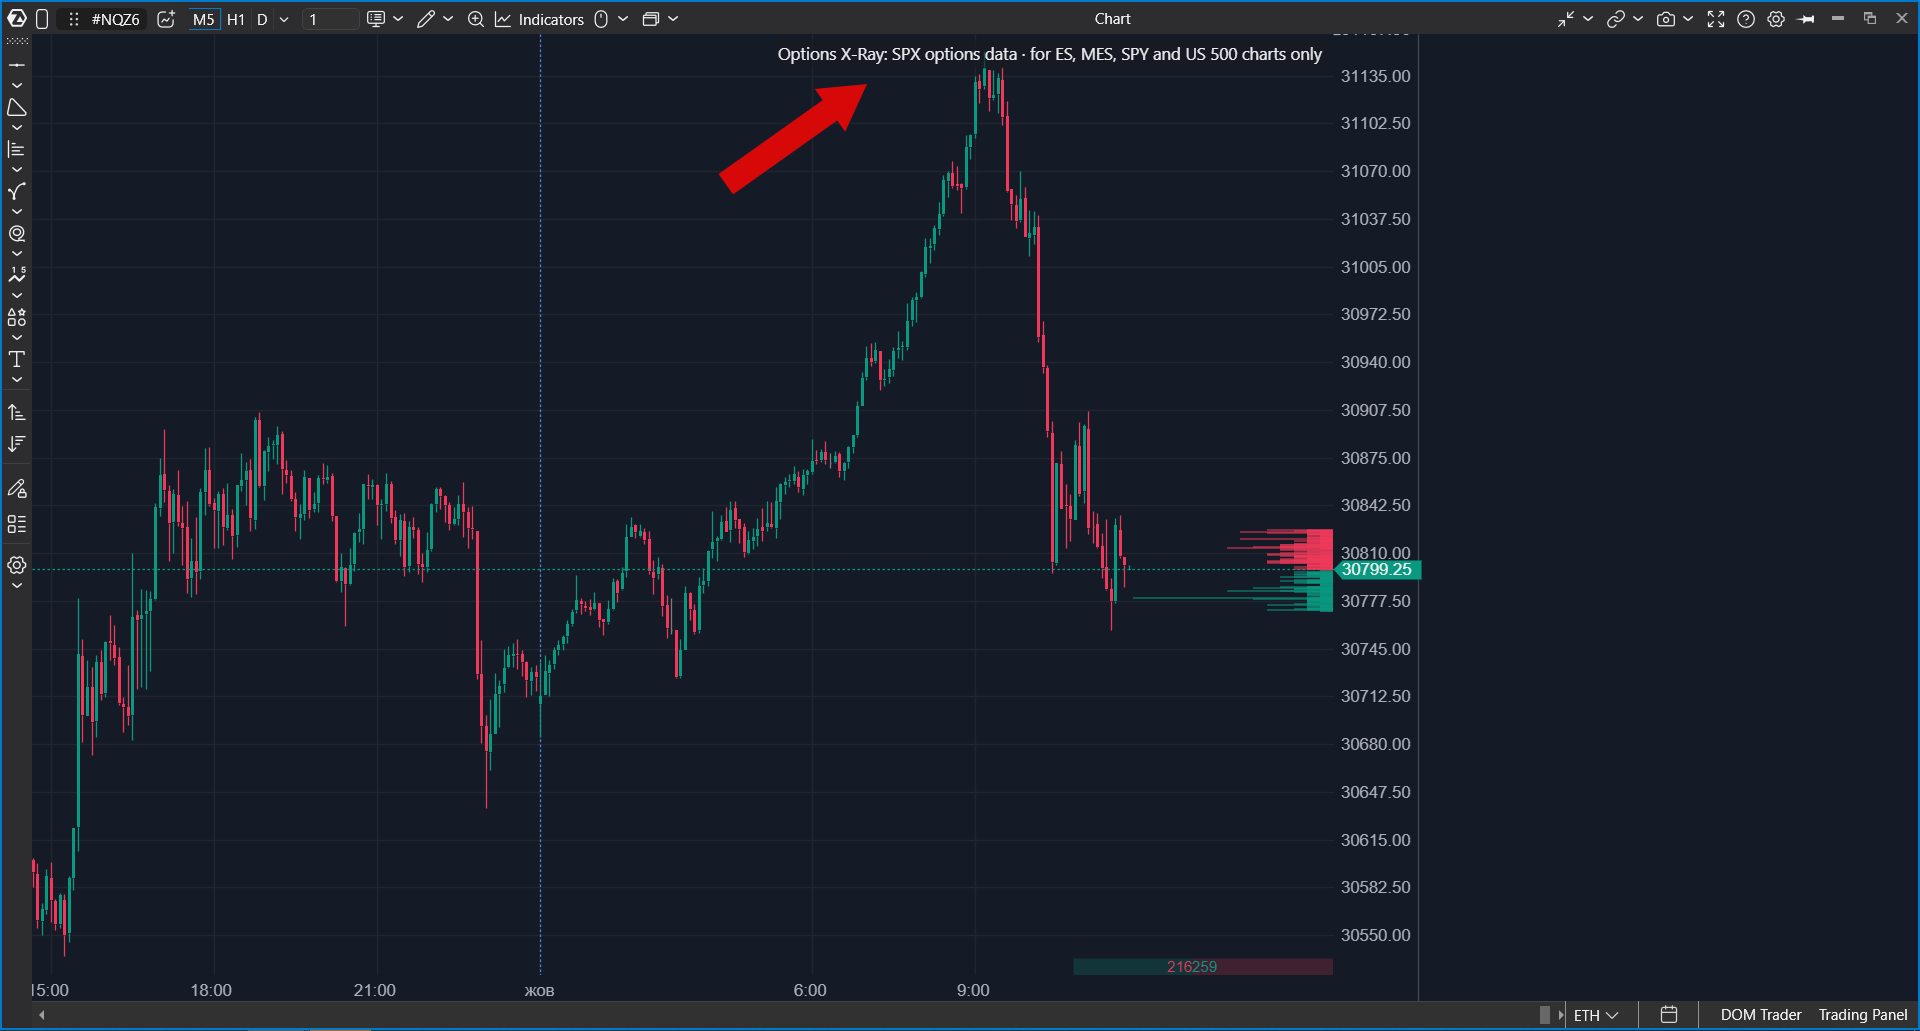
| Other markets | On any other instrument (NQ, oil, gold, individual stocks, crypto) the indicator draws nothing and shows an explanatory chip instead: Options X-Ray: SPX options data · for ES, MES, SPY and US 500 charts only. For CME futures options, use profiles from the Options Chain set based on option quotes from Interactive Brokers or Rithmic. |
| Update frequency | The profile updates once per minute, about 390 profiles during the main session. |
| Units | Values are shown in ES contracts, not option contracts. They show risk at the strike converted into ES futures exposure. Level labels in the card name the instrument of the current chart, for example ES on an ES chart or US500 on a US 500 chart. |
| Access | Options X-Ray indicators are part of a separate package. If the indicator is not in the list, check whether the package is enabled in your account. |
| Data | Built on minute-level SPX options positioning analytics derived from CBOE market data. Data & analytics by OptionsDepth. |
This is not open interest. The profile shows risk at a strike, not the number of contracts. A far strike with many contracts can take little space in this profile if it barely affects price. For this reason, the values do not match open-interest charts.
How to Read the Profile
Each bar is one strike. Bar length shows position size. Colors are configured in settings: by default, green means long position and red means short position.
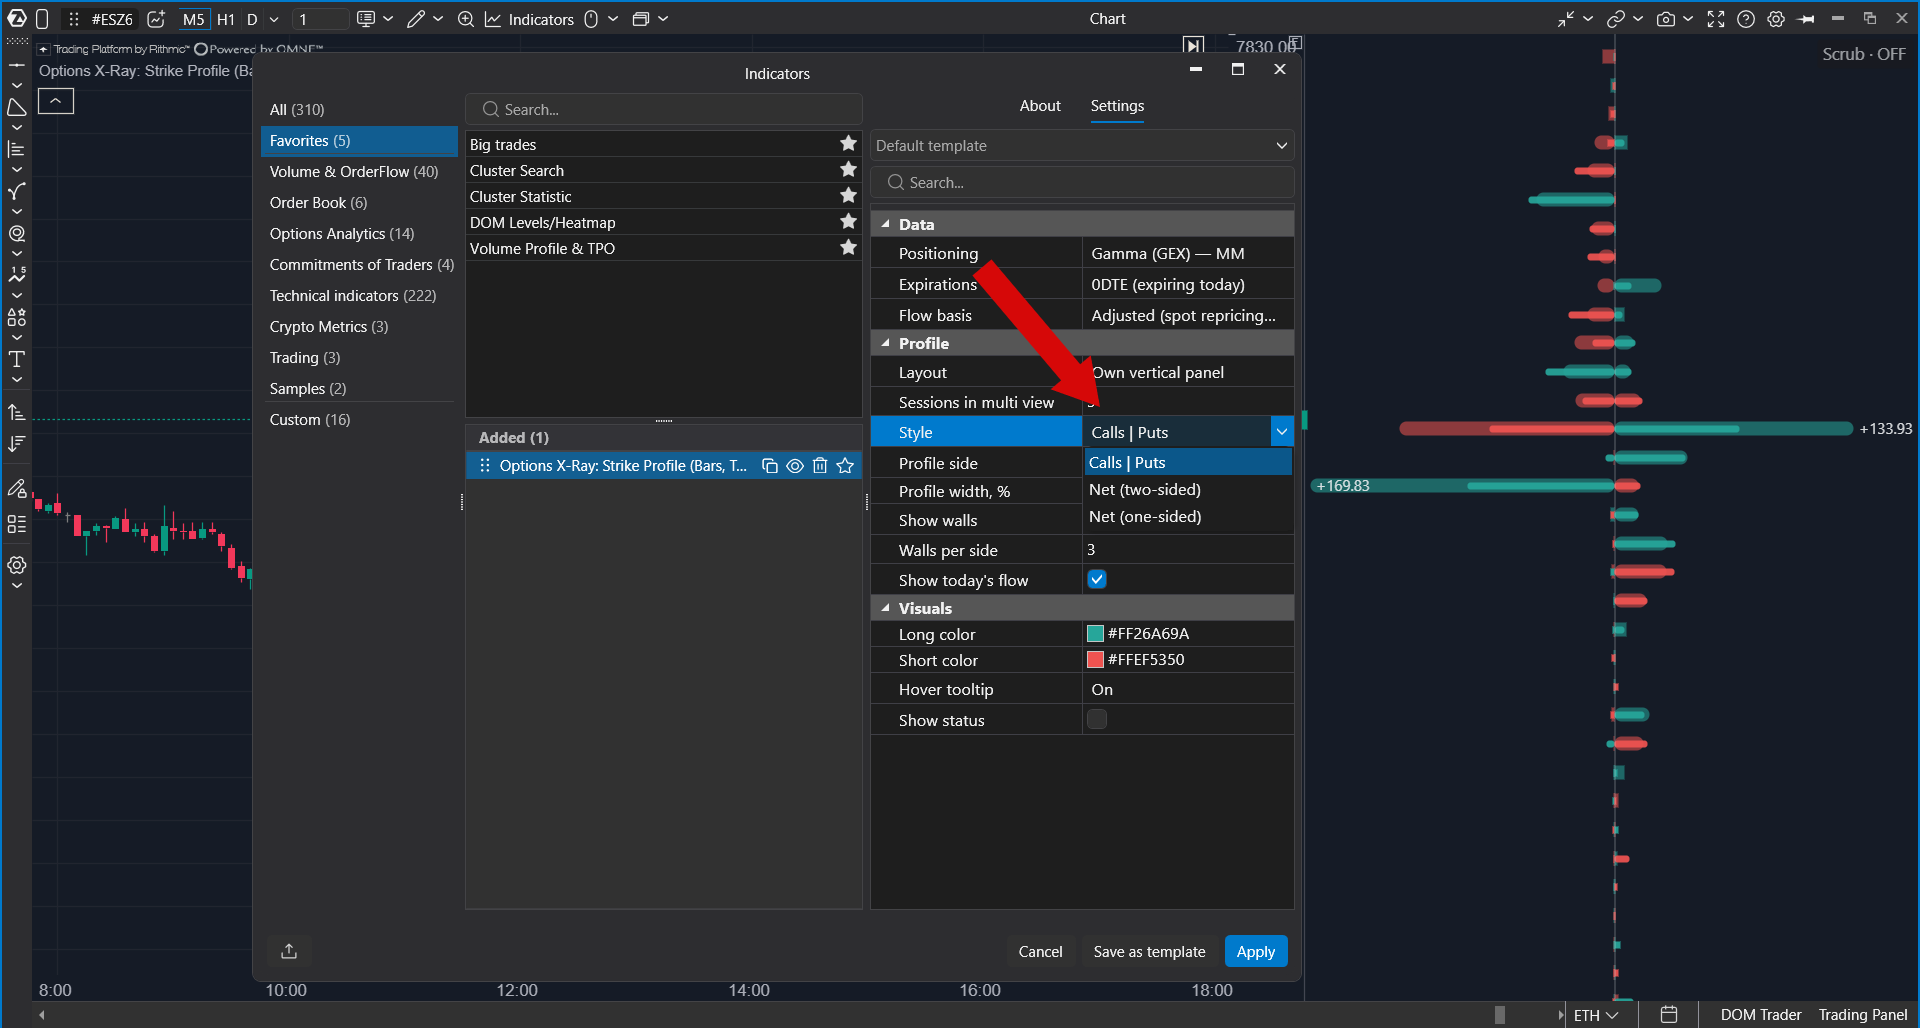
The Style setting controls how bars are drawn.
| Style | How it looks |
| Calls | Puts | A butterfly layout: call options on one side of the axis and put options on the other side. |
| Net, two-sided | One bar per strike: negative values extend left, positive values extend right. This is the default. |
| Net, one-sided | All bars extend from one edge across the profile width, and the sign is shown only by color. Bars are longer, making differences between levels easier to see. |
 Profile for Any Moment
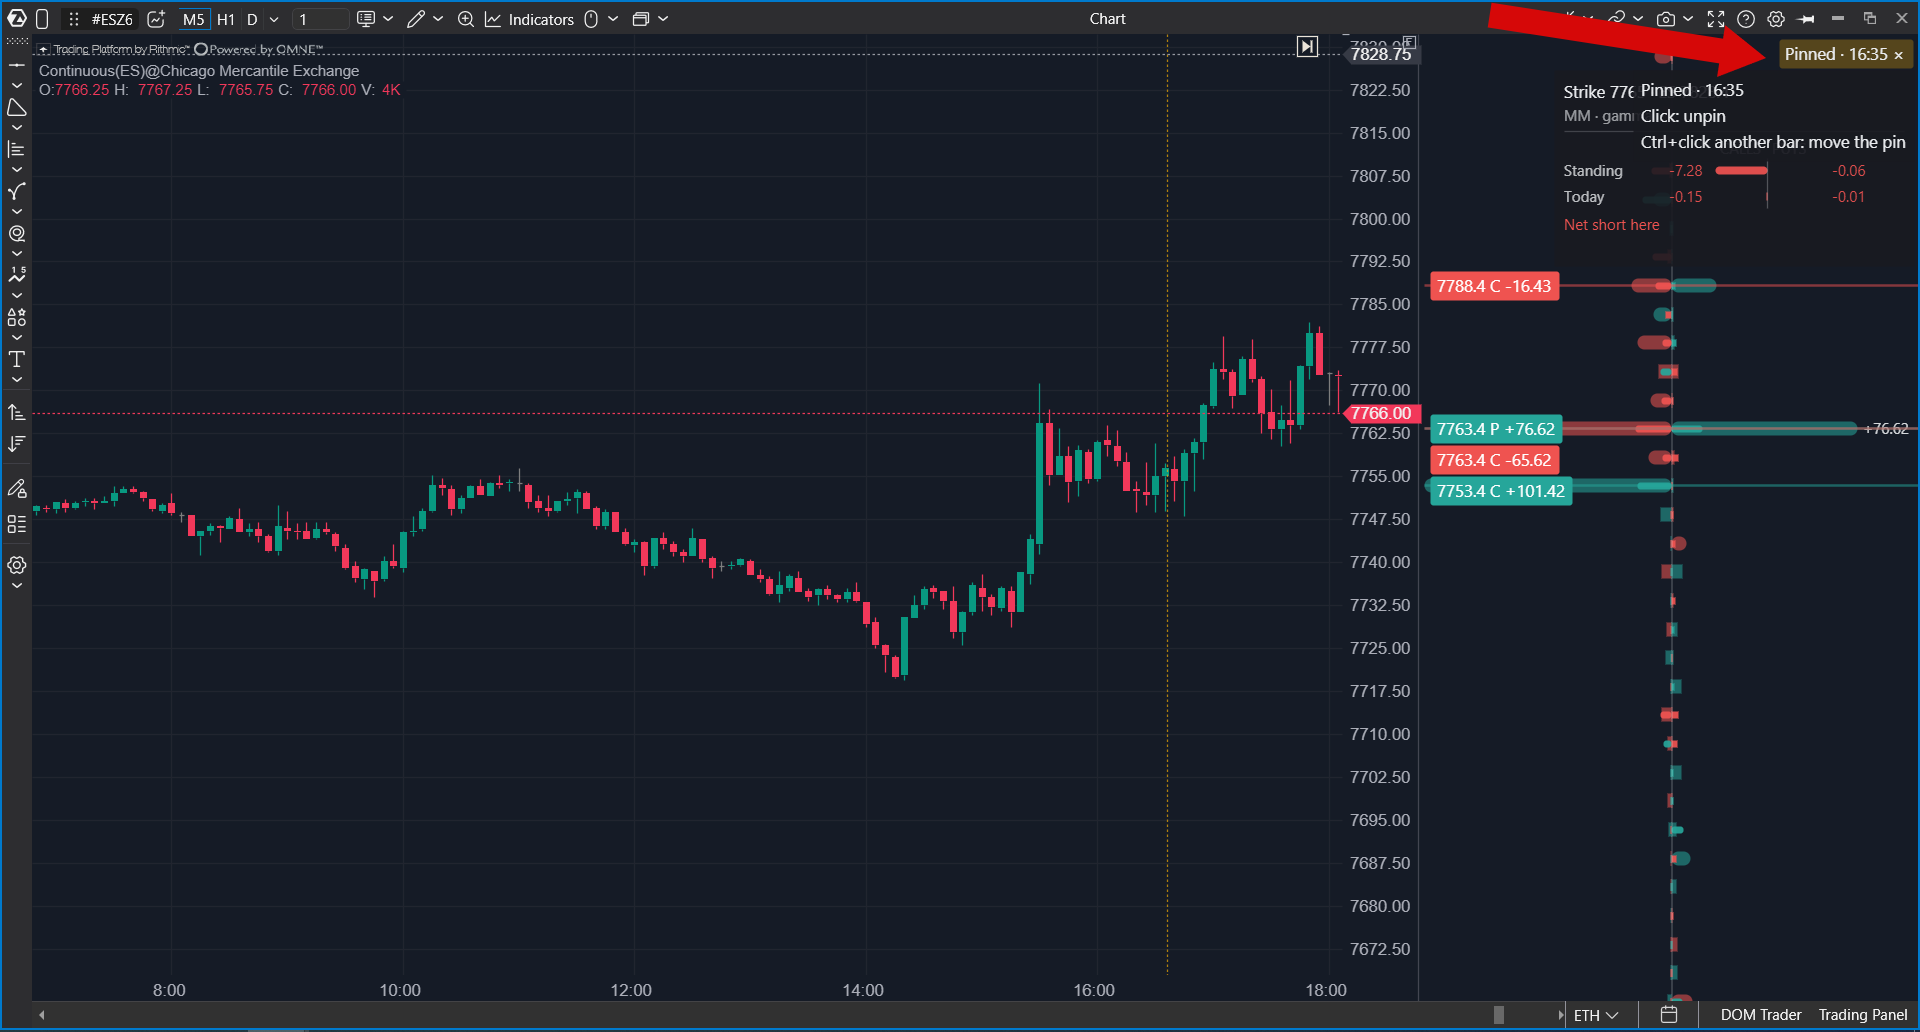
The profile has a time-mode label. There are three modes.
| Mode | How to enable it | What happens |
| Under cursor | Move the cursor across the chart. | The profile switches to the bar under the cursor. |
| Last bar | Click the label. | The profile shows the current candle. |
| Pinned bar | Ctrl + click a bar. | The profile is fixed on that bar. A dashed marker appears on the bar, and the label changes to a pinned state. Ctrl + click another bar to move the pin; click the label to remove it. |
Hover over the label to see a tooltip explaining the modes.
Layout: Where the Profile Is Drawn
 By default, the profile opens in its own vertical panel next to the candles. The price scale is shared, so levels still line up with the chart. The Layout setting selects where and how the profile is drawn.
| Layout | How it looks |
| Own vertical panel | The profile is drawn in a separate panel next to the candles. This is the default. |
| Overlay on chart | The profile is drawn over the candles at the edge selected in Profile side. |
| Multi-session · own panel | Several sessions are shown as columns in a separate panel. |
| Multi-session · overlay | Several sessions are drawn over the candles, each next to its own bars. |
Sessions in multi view sets how many sessions the multi-session layouts show, including the selected one: from 2 to 5, 3 by default.
Multi-Session View
The multi-session layouts show the selected session next to up to four previous ones. Each past session is a snapshot taken at its session close — the one canonical moment of that day.
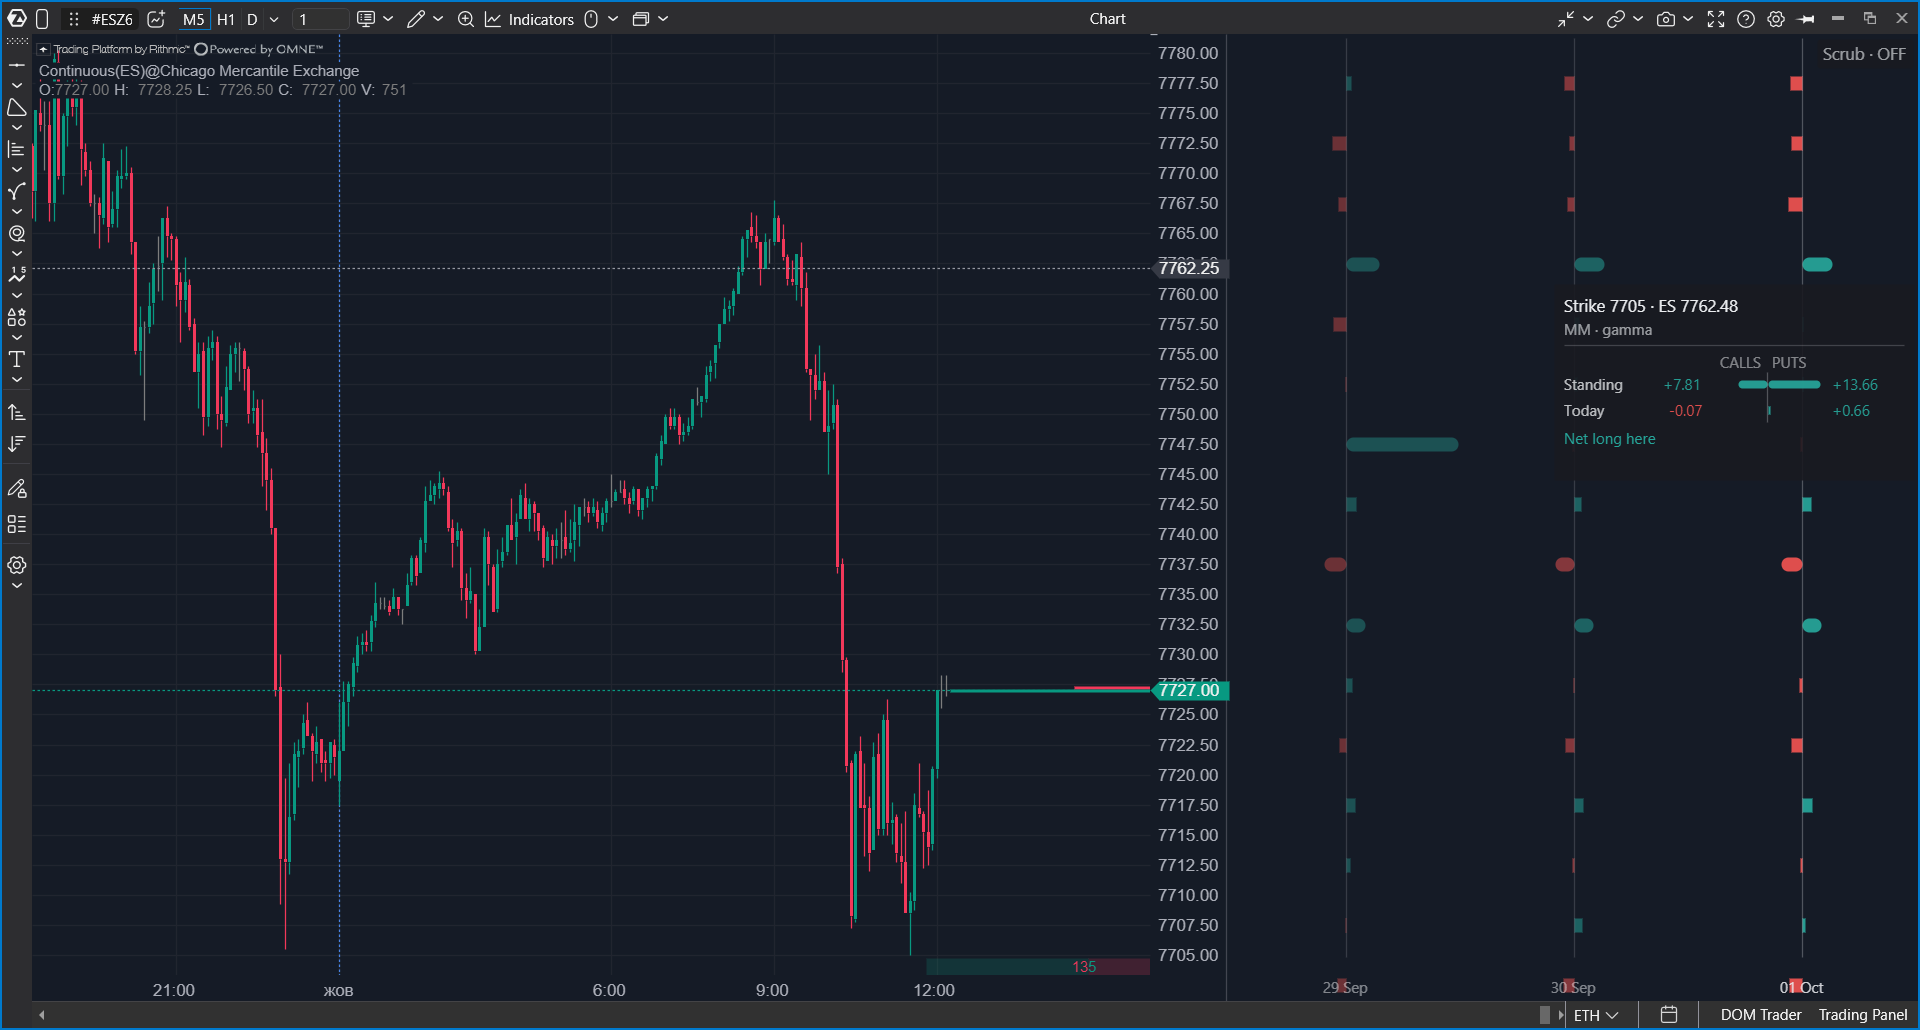
- In the overlay layout, every profile is anchored to the bar of its session close, so profiles stay attached to their own candles at any zoom level. A column is never wider than the room its session occupies on screen.
- Past sessions fade with age and are labeled with their date. When the traded series changed between days, the label also shows the expiration date.
- All columns share one width scale. A thinner Tuesday next to a wider Monday reflects the market, not a drawing artifact.
This makes the weekly story of positioning — how the book was built day by day — visible at a glance.
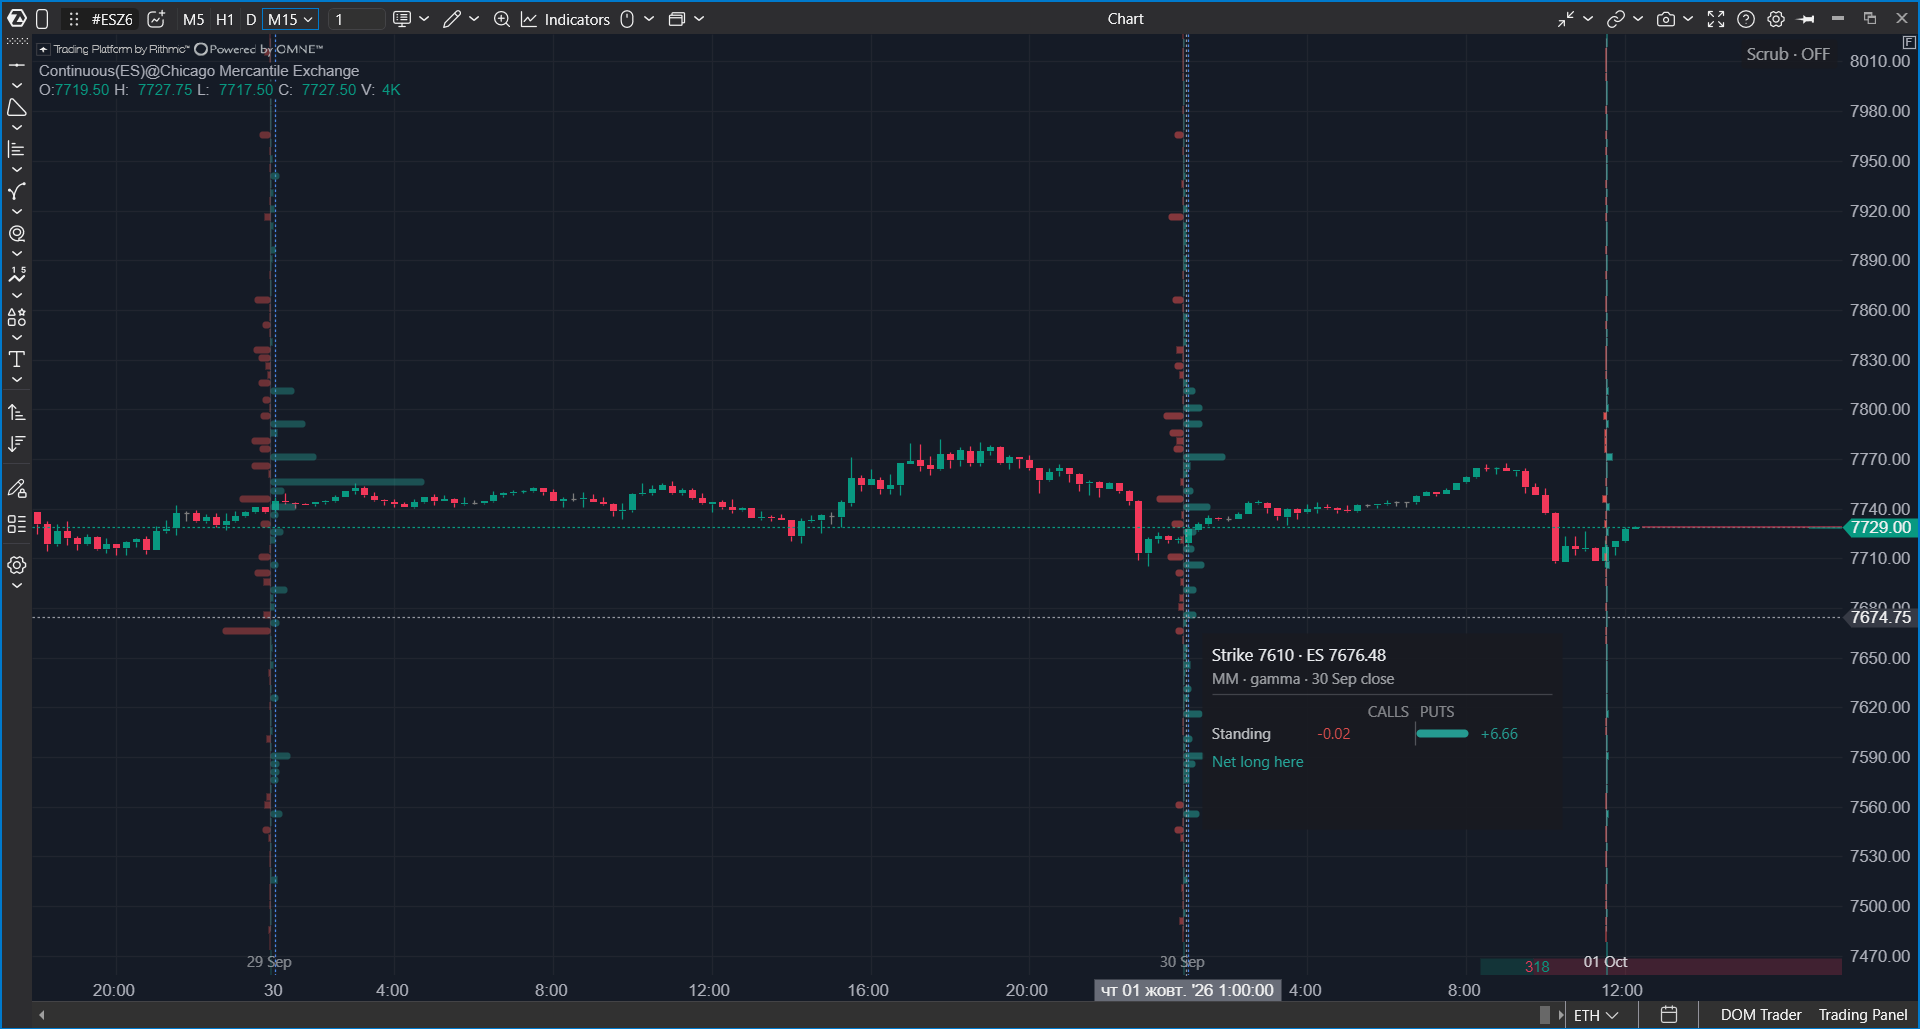
The hover card works over any column. Over the selected session, it is the full card, including the Today row. Over a past session, the card shows that session's closing snapshot: there is no Today row, because today's flow does not apply to another day, and the card subtitle names the moment explicitly, for example … · 18 Sep close.
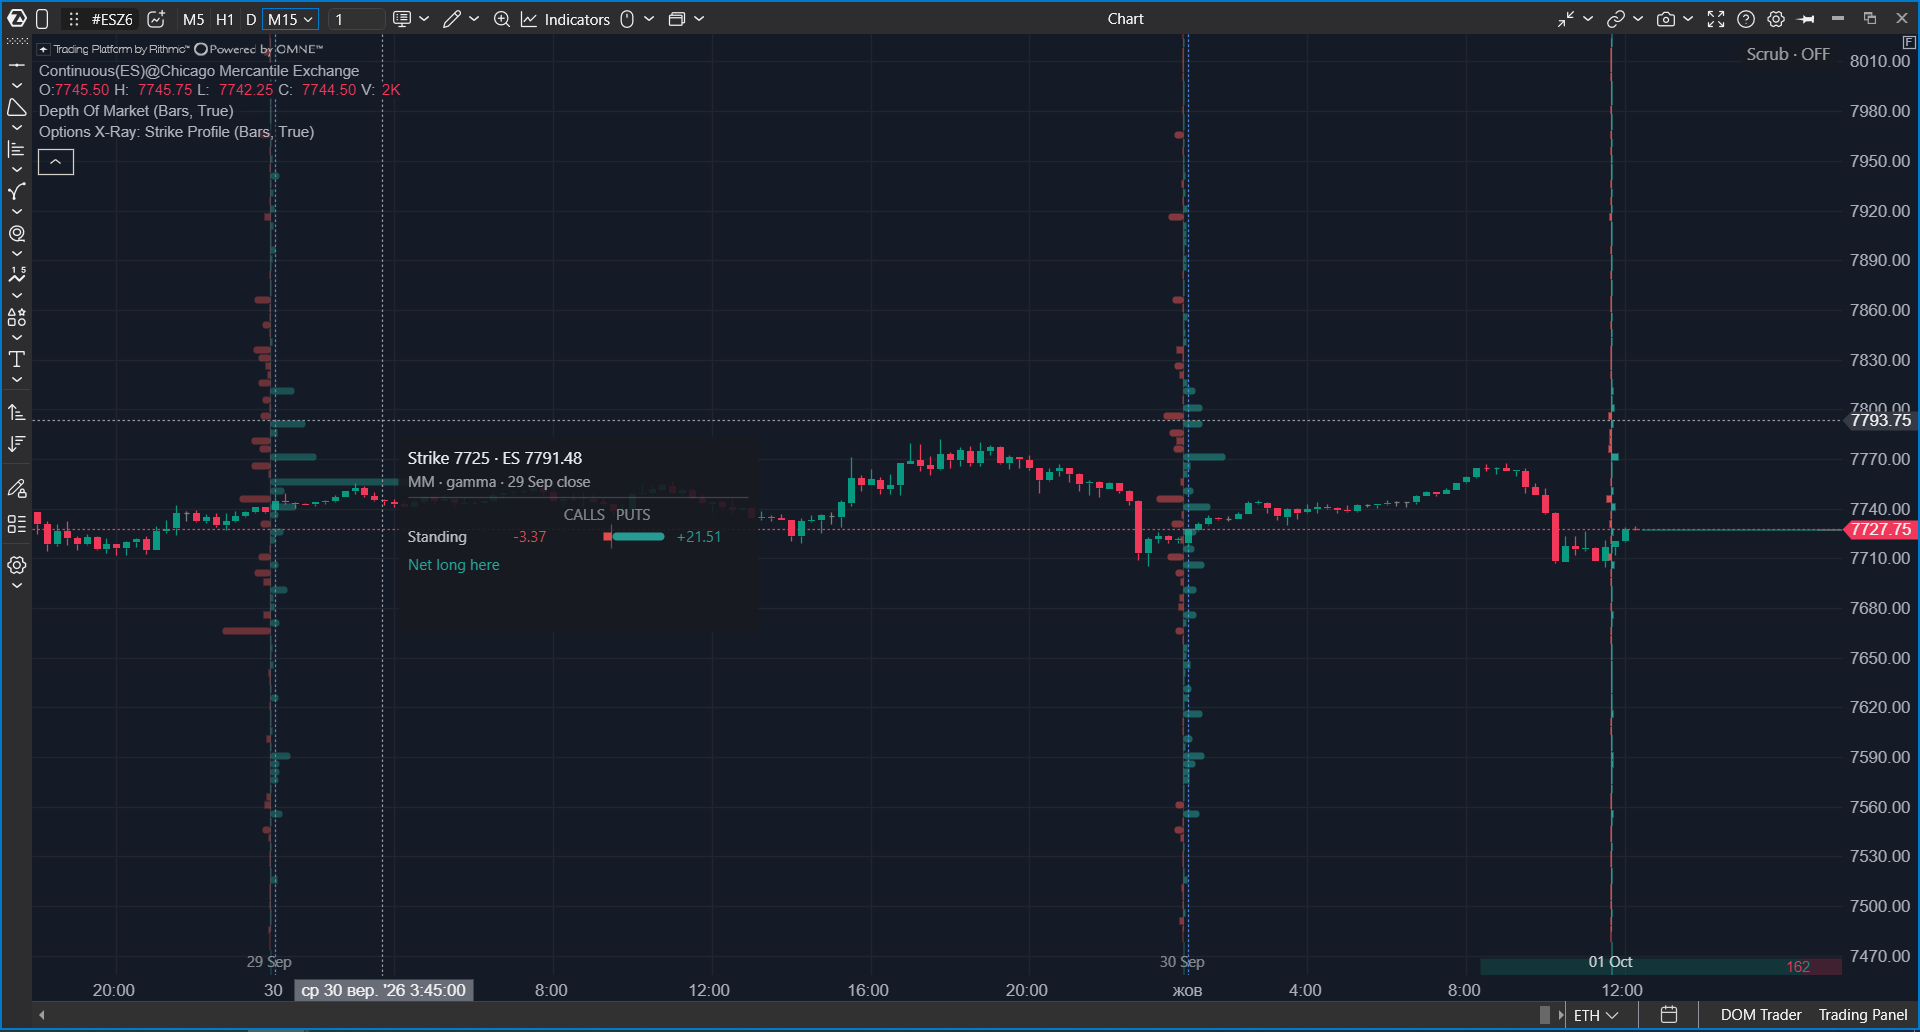
In the multi-session layouts, the profile is always drawn in the Net style. The butterfly layout is not readable in narrow columns.
Positioning: What to Show
The Positioning setting selects the value shown in the profile.
| Value | What it shows |
| Gamma (GEX) — MM | Where market-maker hedging may damp or amplify price movement. This is the default. |
| Delta (DEX) — MM | How many ES futures market makers hold against each strike. |
| Vanna (VEX) — MM | Where market makers may need to trade ES futures if volatility changes. |
| Charm (CEX) — MM | Where market makers may need to trade ES futures because time passes. |
| Participant group position | The position of retail traders, professionals, firms, brokers, or all clients together, without market makers. |
The Expirations setting selects which options are included. The default is 0DTE (expiring today). Other choices include the next expiration, E+2, E+3, E+4, This week, Rest of week, OPEX monthly, End of month, options within 7 days, or all options.
Tooltip Card
Hover over a profile bar to open a strike card.
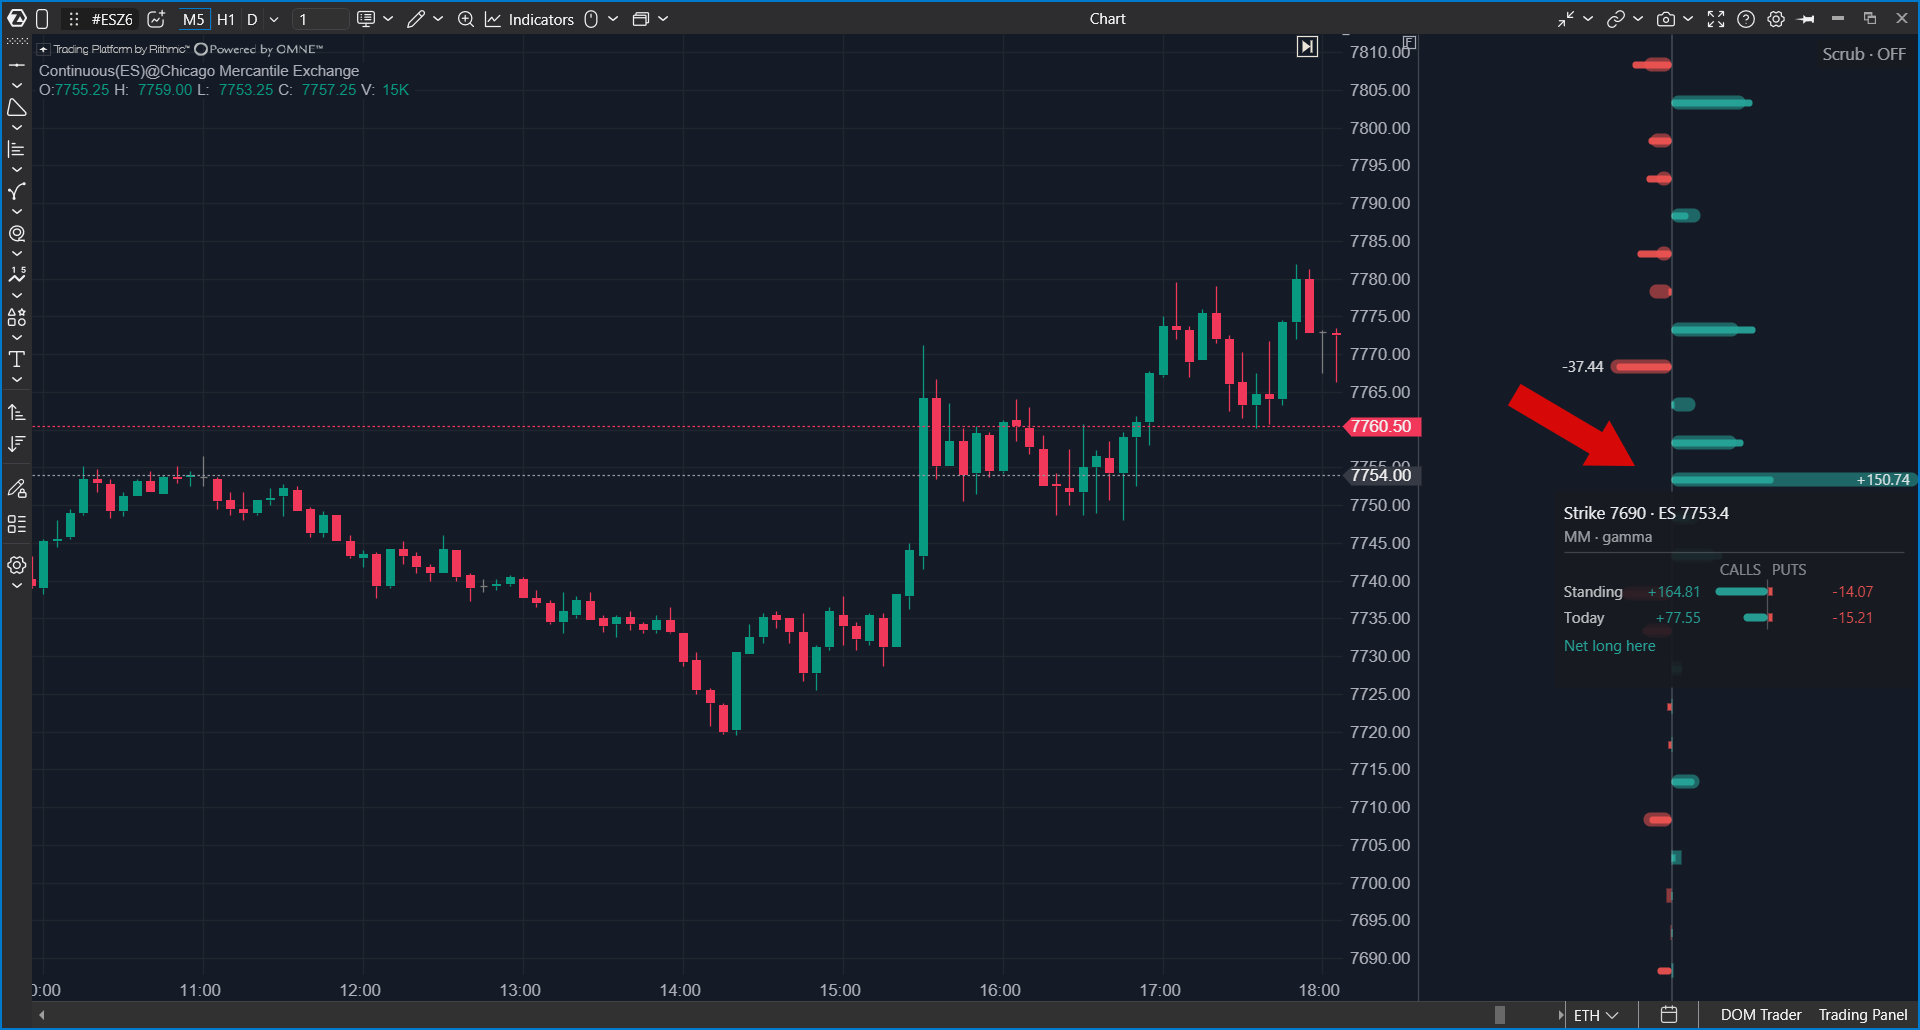
| Card part | What it shows |
| Calls | Puts | Calls are shown on one side and puts on the other, using long and short position colors. |
| Standing | The position accumulated at the strike by the selected bar, including previous days. |
| Today | How much the position changed during the current session. Not shown over past sessions in the multi-session layouts. |
| Net long here / Net short here | The final conclusion: whether the position at this strike is net long or net short. |
Standing and Today can point in different directions. For example, retail traders may still hold puts bought earlier, while selling them today. This contrast can be useful by itself.
How to Add the Indicator
- Open an ES, MES, SPY, or US 500 chart.
- Click Indicators on the top panel.
- Select the Options Analytics group or type Options in search.
- Select Options X-Ray: Strike Profile (GEX/DEX/VEX/CEX).
- Click Add to chart.
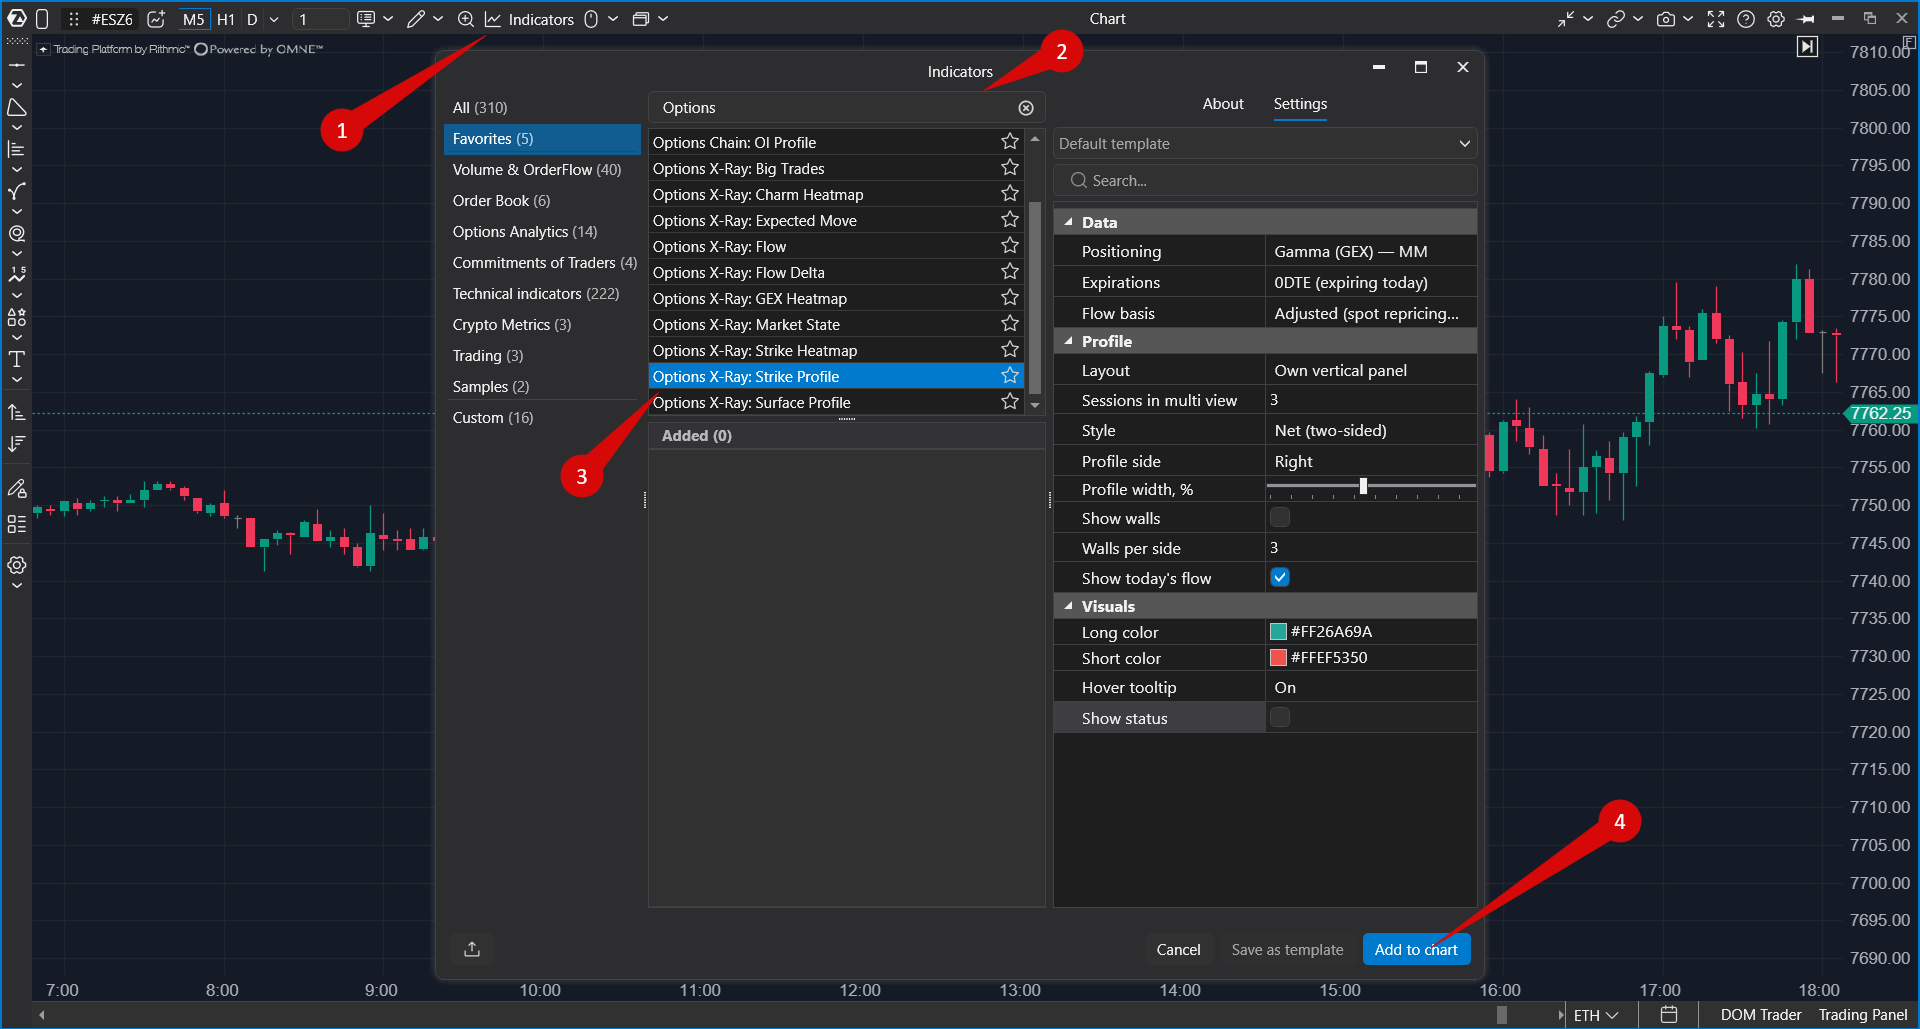 The profile opens in its own panel next to the candles. To change settings later, open Indicators again, select the indicator in the Added section, and click Apply.
Settings
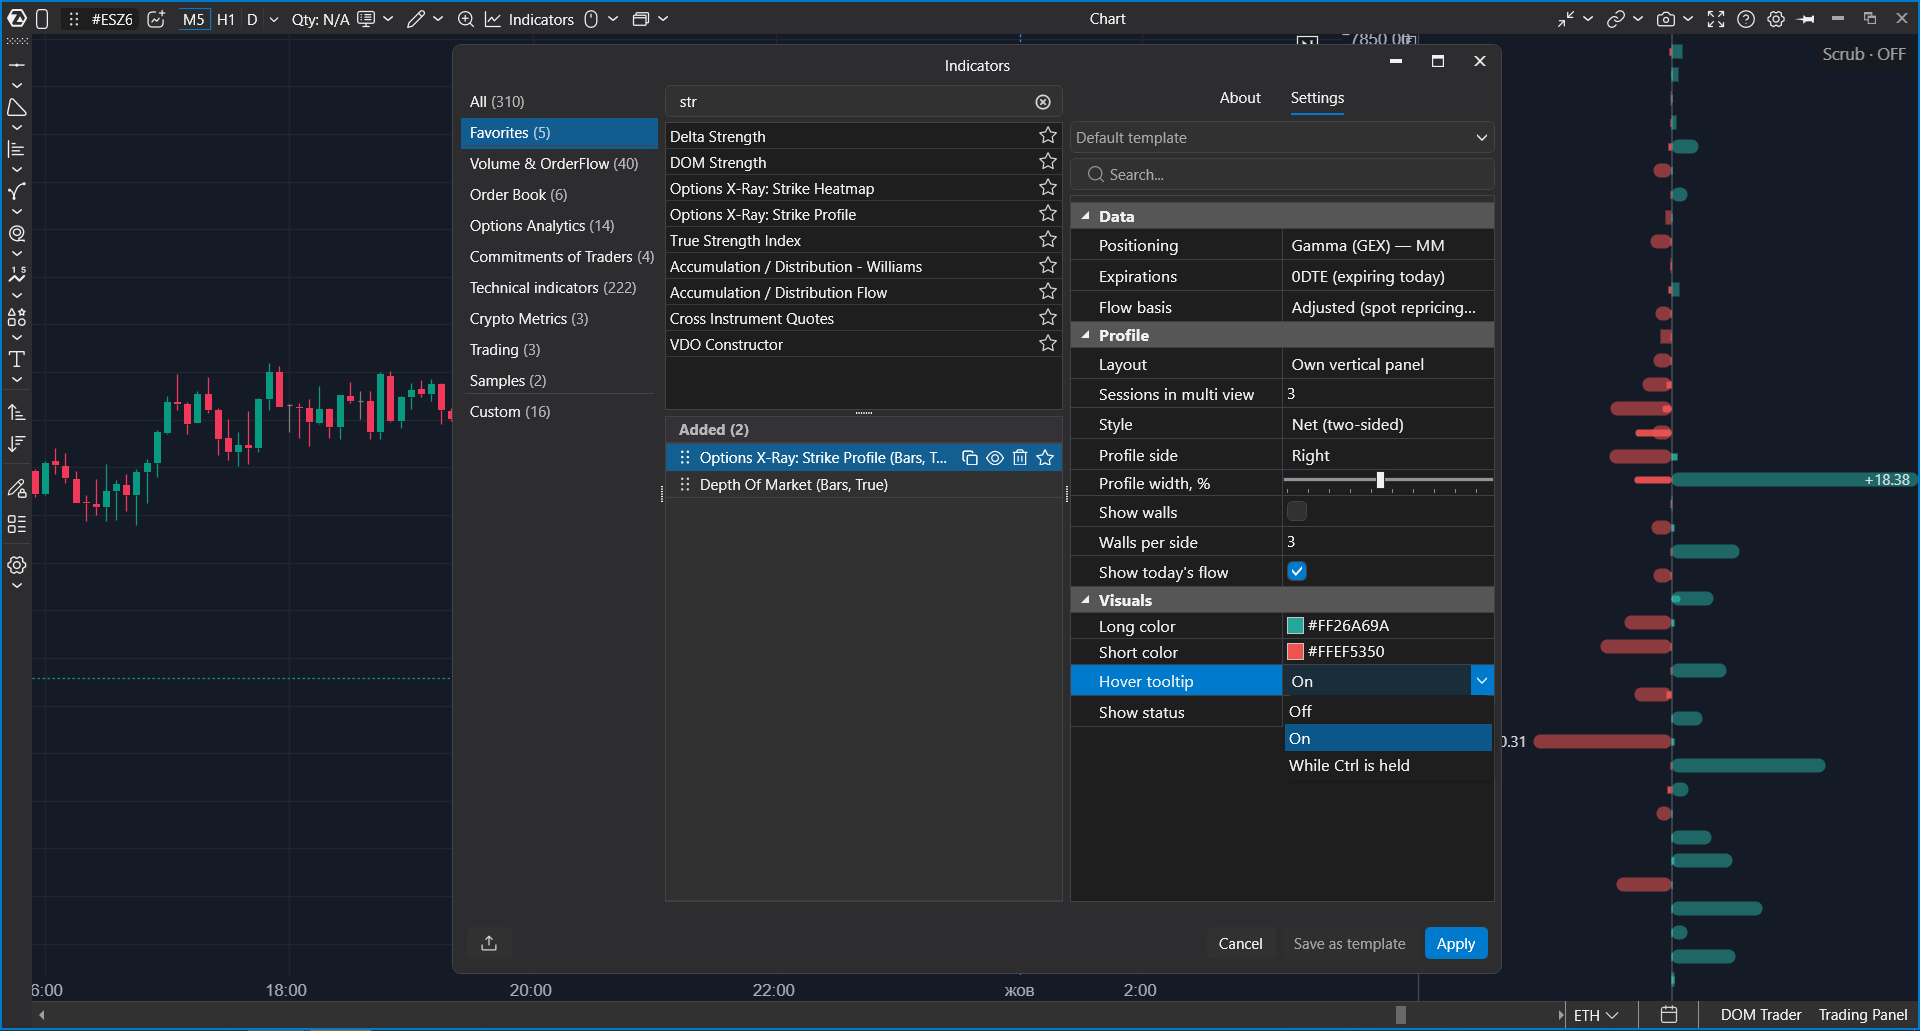
| Setting | What it does |
| Positioning | Selects which value to show. The default is Gamma (GEX) — MM. |
| Expirations | Selects which options are included. The default is 0DTE (expiring today). |
| Flow basis | Defines how position changes are calculated. The default is Adjusted. If you compare several charts or indicators, use the same value everywhere. |
| Layout | Selects where the profile is drawn: Own vertical panel (default), Overlay on chart, Multi-session · own panel, or Multi-session · overlay. |
| Sessions in multi view | How many sessions the multi-session layouts show, including the selected one: from 2 to 5. The default is 3. |
| Style | Selects how bars are drawn. The default is Net, two-sided. In the multi-session layouts, the Net style is always used. |
| Profile side | Selects which side of the chart the profile is drawn on in the Overlay on chart layout. The default is Right. |
| Profile width, % | Controls profile width as a percentage of chart width. |
| Show walls | Marks the largest positive and negative strike levels. Disabled by default. |
| Walls per side | Sets how many walls are marked on each side. The default is 3. |
| Show today's flow | Shows how much positions changed during the current session. Enabled by default. |
| Long color | Color for long positions. The default is green. |
| Short color | Color for short positions. The default is red. |
| Hover tooltip | Controls the hover card: Off, On (default), or While Ctrl is held. The Ctrl mode keeps the chart clean and shows the card only on demand. |
| Show status | Shows the indicator status line. It is disabled by default. |
How to Work With the Indicator
Strike Profile pairs with Options X-Ray: Strike Heatmap. They show the same data in different ways.
| Indicator | When it is more useful |
| Strike Profile | When you need an exact snapshot for a specific moment, with numeric values, or a day-by-day comparison in the multi-session layouts. |
| Strike Heatmap | When you need the session story: where levels appeared, strengthened, and disappeared. |
- Check the profile on the last bar: where are the largest levels near price?
- Move the cursor through the morning: what did these levels look like earlier?
- Pin the profile with Ctrl + click on a bar before a sharp move and compare it with the current profile.
- Hover over a large strike and compare Standing with Today: is it an old position or was it built today?
- Switch Positioning to a participant group to see whose position it is.
- Switch Layout to a multi-session layout to see how the positions were built over the previous days.
Troubleshooting
| What happens | What to do |
| The indicator is not in the list | Check whether the Options X-Ray package is enabled in your account. |
| The profile is not drawn, and the chart shows the chip "Options X-Ray: SPX options data · for ES, MES, SPY and US 500 charts only" | The chart instrument is not supported. Open an ES, MES, SPY, or US 500 chart. |
| The profile is not drawn on a supported chart | During weekends and holidays there is no new data, but previous sessions should still be displayed. |
| The profile keeps changing when you move the mouse | This is the under-cursor mode. Click the label to return to the last bar, or pin the required bar with Ctrl + click. |
| The profile covers candles | Reduce Profile width, % or set Layout to Own vertical panel. |
| The butterfly style is not used in the multi-session layouts | This is expected. Narrow columns always use the Net style. |
| Values do not match open interest | This is expected. The profile shows risk at the strike, not the number of contracts. |
| Rest of week is empty | If today is Friday, this is expected. |
| The profile changed sharply on Friday morning | If 0DTE is selected and it is the third Friday of the month, the monthly series may have expired after 09:15 and the indicator switched to weekly options. This is expected. |
| Levels look inaccurate, and the status mentions calibration | The chart does not have enough history to map index levels to the chart accurately. Load more days on the chart and enable Show status if needed. |
Was this article helpful?
That’s Great!
Thank you for your feedback
Sorry! We couldn't be helpful
Thank you for your feedback
Feedback sent
We appreciate your effort and will try to fix the article