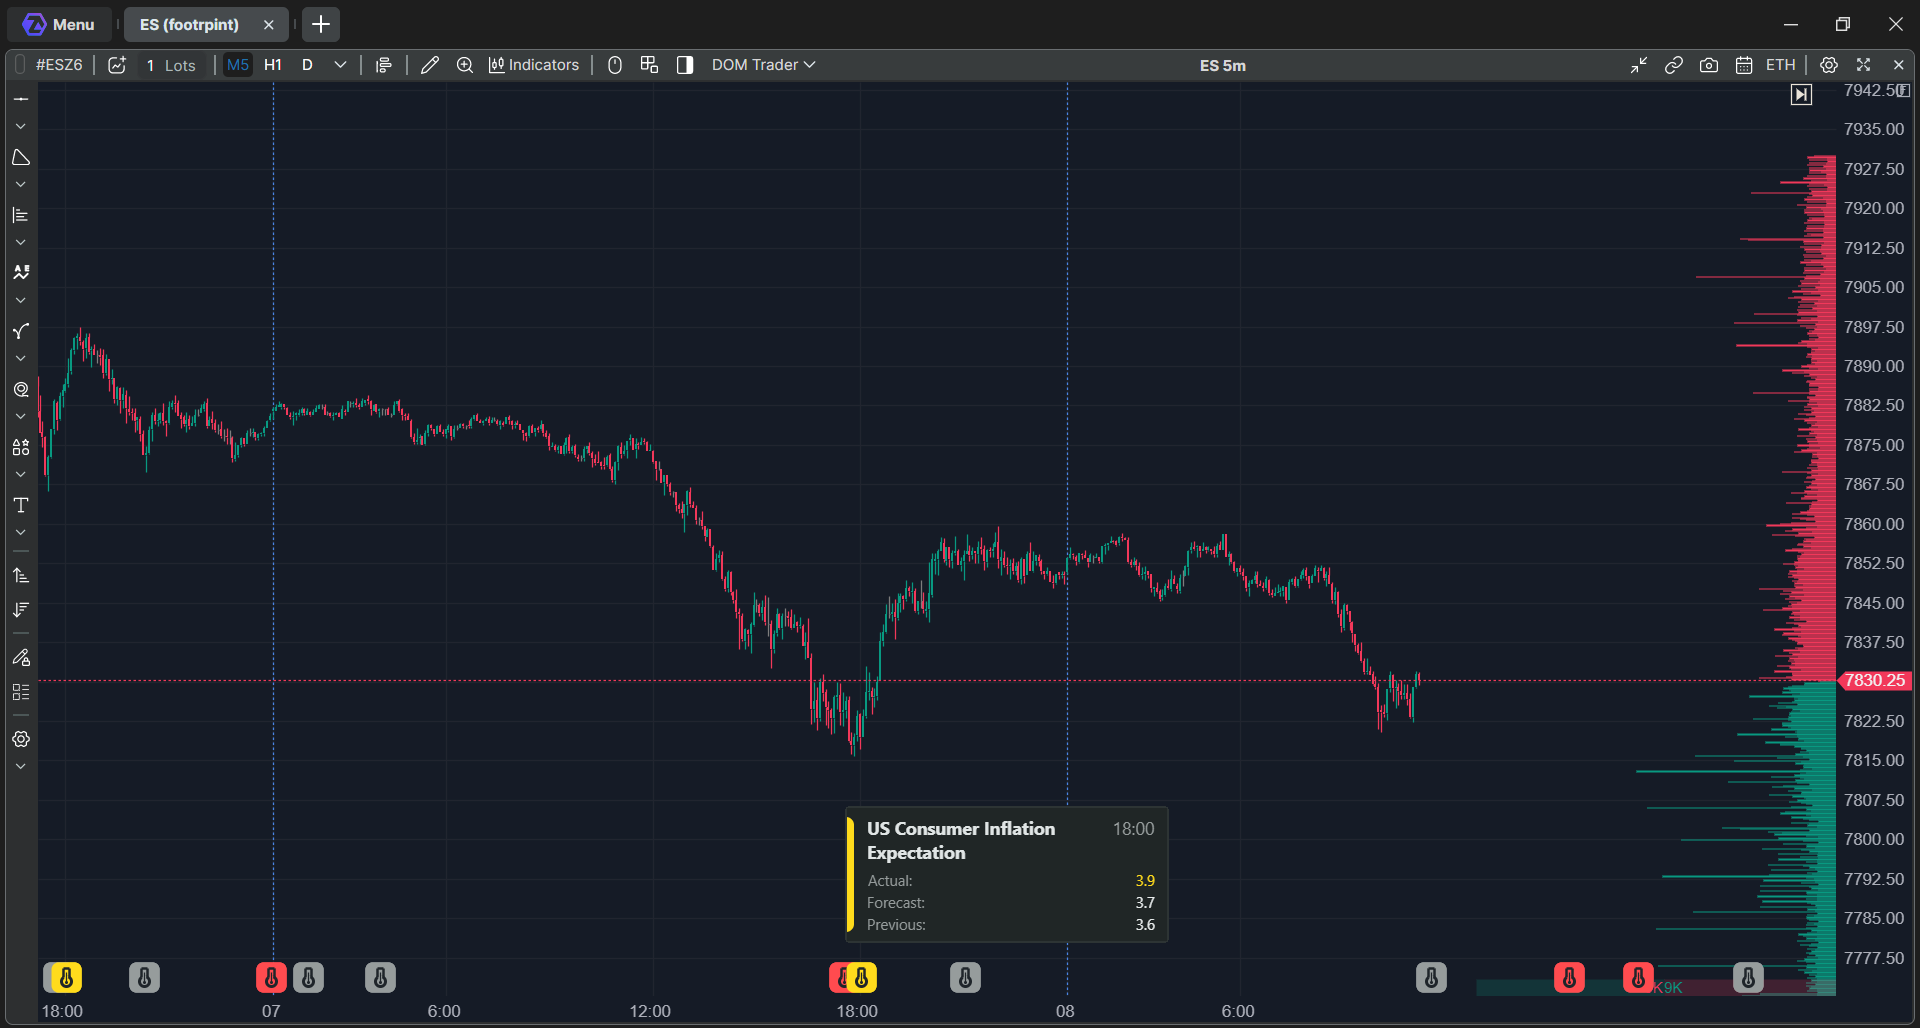
News on Chart shows economic releases and company news right on the chart's time scale. Each event appears as an icon at the bar where it happened, or where it is scheduled to happen. Click the icon to see the event's details.
Why Use It
Major releases such as CPI, Non-Farm Payrolls or a Fed rate decision often move the market sharply. To see how price reacted to past releases, or to know what is coming next, you usually have to keep an economic calendar open in a separate window and match times by hand.
News on Chart puts the calendar on the chart itself:
- past events show at the bar where they came out, so you can see how price reacted;
- upcoming events show to the right of the last bar, at their scheduled time;
- the icon colour shows how important the event is;
- a sound can warn you a few minutes before an important release.
News on Chart is not a trading signal. It shows when an event happens and what the figures were. It does not predict how the market will react.
What You Should Know Before You Start
| Futures | On CME futures charts (for example ES or NQ), the indicator shows events from the US economic calendar: data releases, central bank decisions, speeches. |
| Stocks | On NASDAQ and NYSE stocks, the indicator shows the company's earnings reports, dividends and the latest news headlines about the company. |
| Other instruments | On other instruments the indicator adds nothing to the chart. |
| Time range | Past events load for the whole period loaded on the chart, up to one year back. Upcoming economic events load up to 30 days ahead. Company news headlines cover the last 24 hours. |
| Where icons appear | Along the bottom of the price area, just above the time scale. The indicator always works on the main chart panel. |
| Access | If News on Chart is not in the indicator list, it is not enabled for your account yet. |
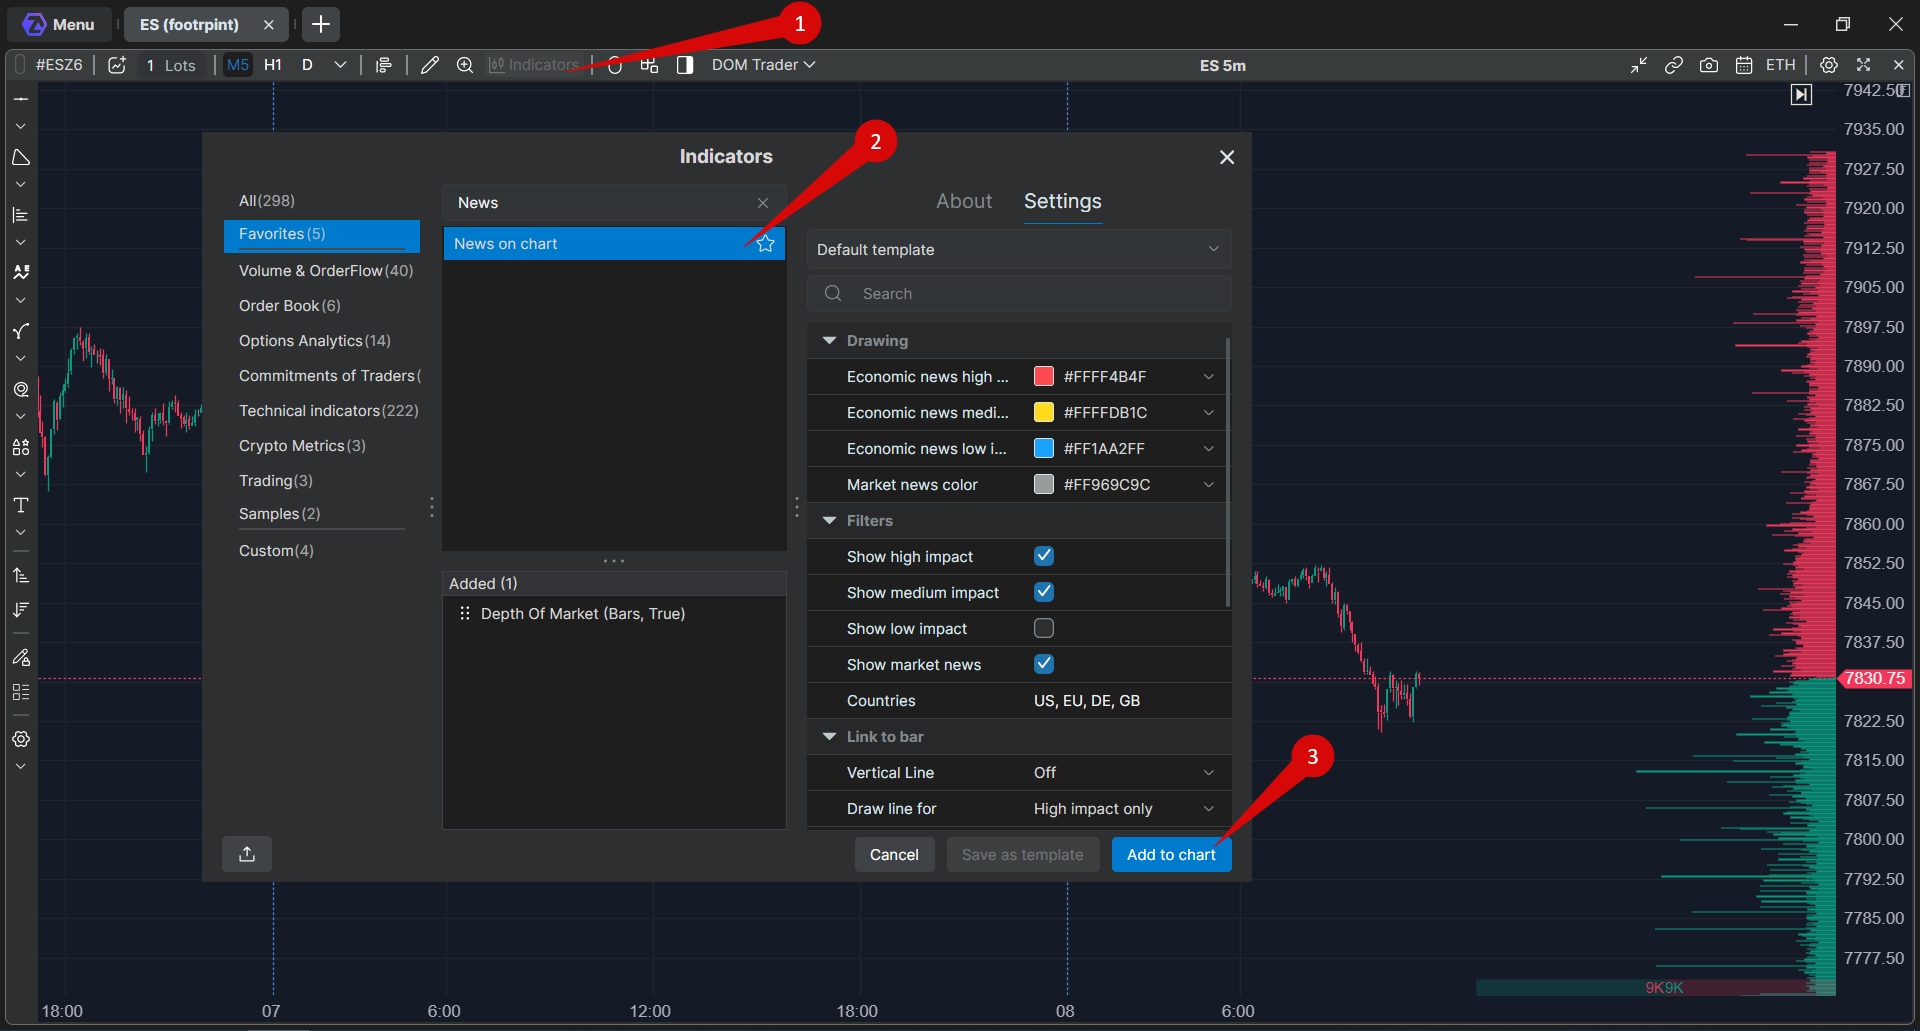
How to Add the Indicator
- Open a chart of a supported instrument.
- Open the indicator list.
- Find News on chart (category Other) and add it.
Icons appear as soon as the event data loads.
How to Read the Icons
| Element | Meaning |
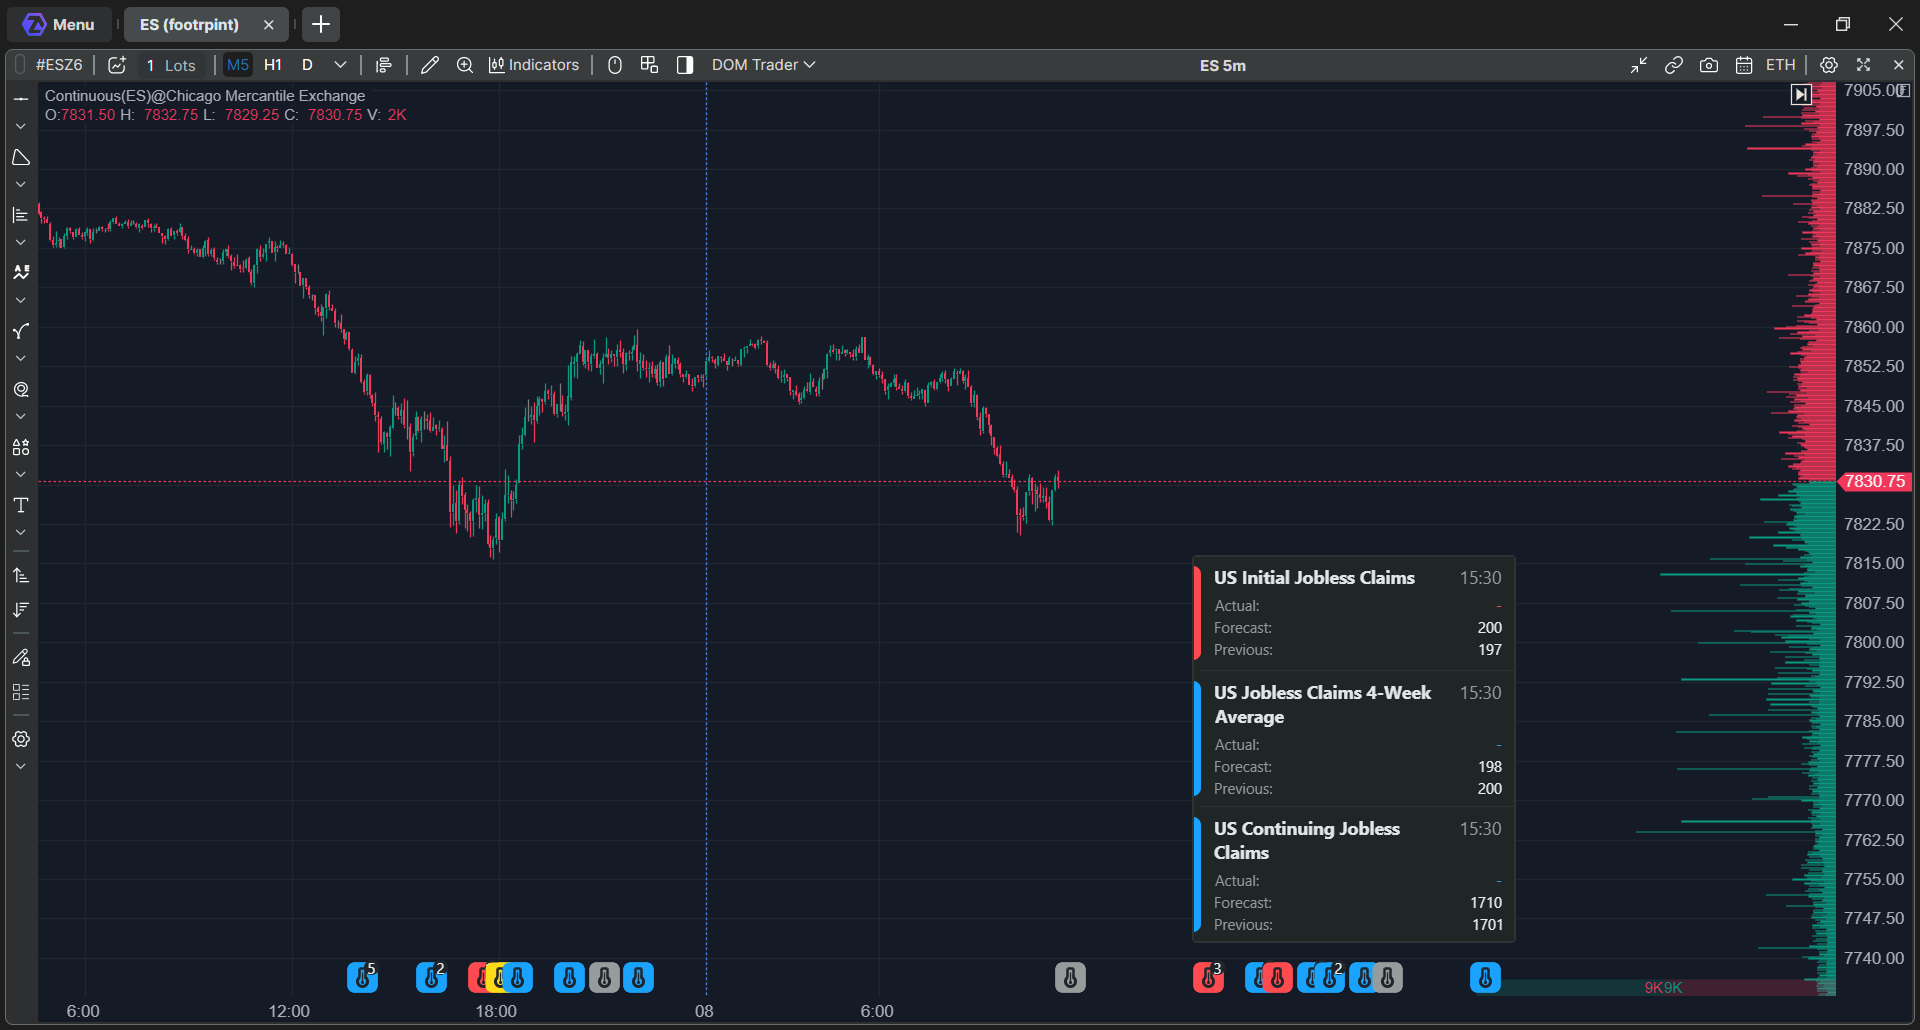
| Red icon | High-impact event. |
| Yellow icon | Medium-impact event. |
| Blue icon | Low-impact event. Earnings reports and paid dividends on stocks are also shown in this colour. |
| Grey icon | Market news: an event without numeric figures, such as a speech or a statement, a company news headline, or an upcoming dividend date. |
| Number on the icon | Several events fall into the same bar. They are combined into one icon, and the icon takes the colour of the most important event in the group. |
| Icons to the right of the last bar | Upcoming events, placed at their scheduled time. Scroll the chart to the right to see them. |
All colours can be changed in the indicator settings.
[SCREENSHOT NEEDED: close-up of icons in different colours, one of them with a number badge, plus upcoming icons to the right of the last bar]
Event Cards
Click an icon to open its card. Click the icon again, or click anywhere else on the chart, to close it.
A card for an economic event shows:
- the country and the name of the event, for example US Non Farm Payrolls;
- the release time;
- Actual: the published value, in the colour of the event's importance;
- Forecast: the expected value;
- Previous: the value from the previous period.
If a value is not available, the card shows a dash. For an upcoming event, Actual stays empty until the release. After the release time, the indicator checks for the new value every minute and adds it to the card as soon as it is published.
A news headline card shows the topic, how long ago the news came out, and the headline. Click the headline to open the full article in your browser. On stocks, the three latest headlines are grouped at the last bar.
If several events fall into the same bar, their cards open as a stack sorted by importance, with the most important event on top. The stack shows up to three cards at a time. If there are more, scroll the stack with the mouse wheel.
Settings
Filters
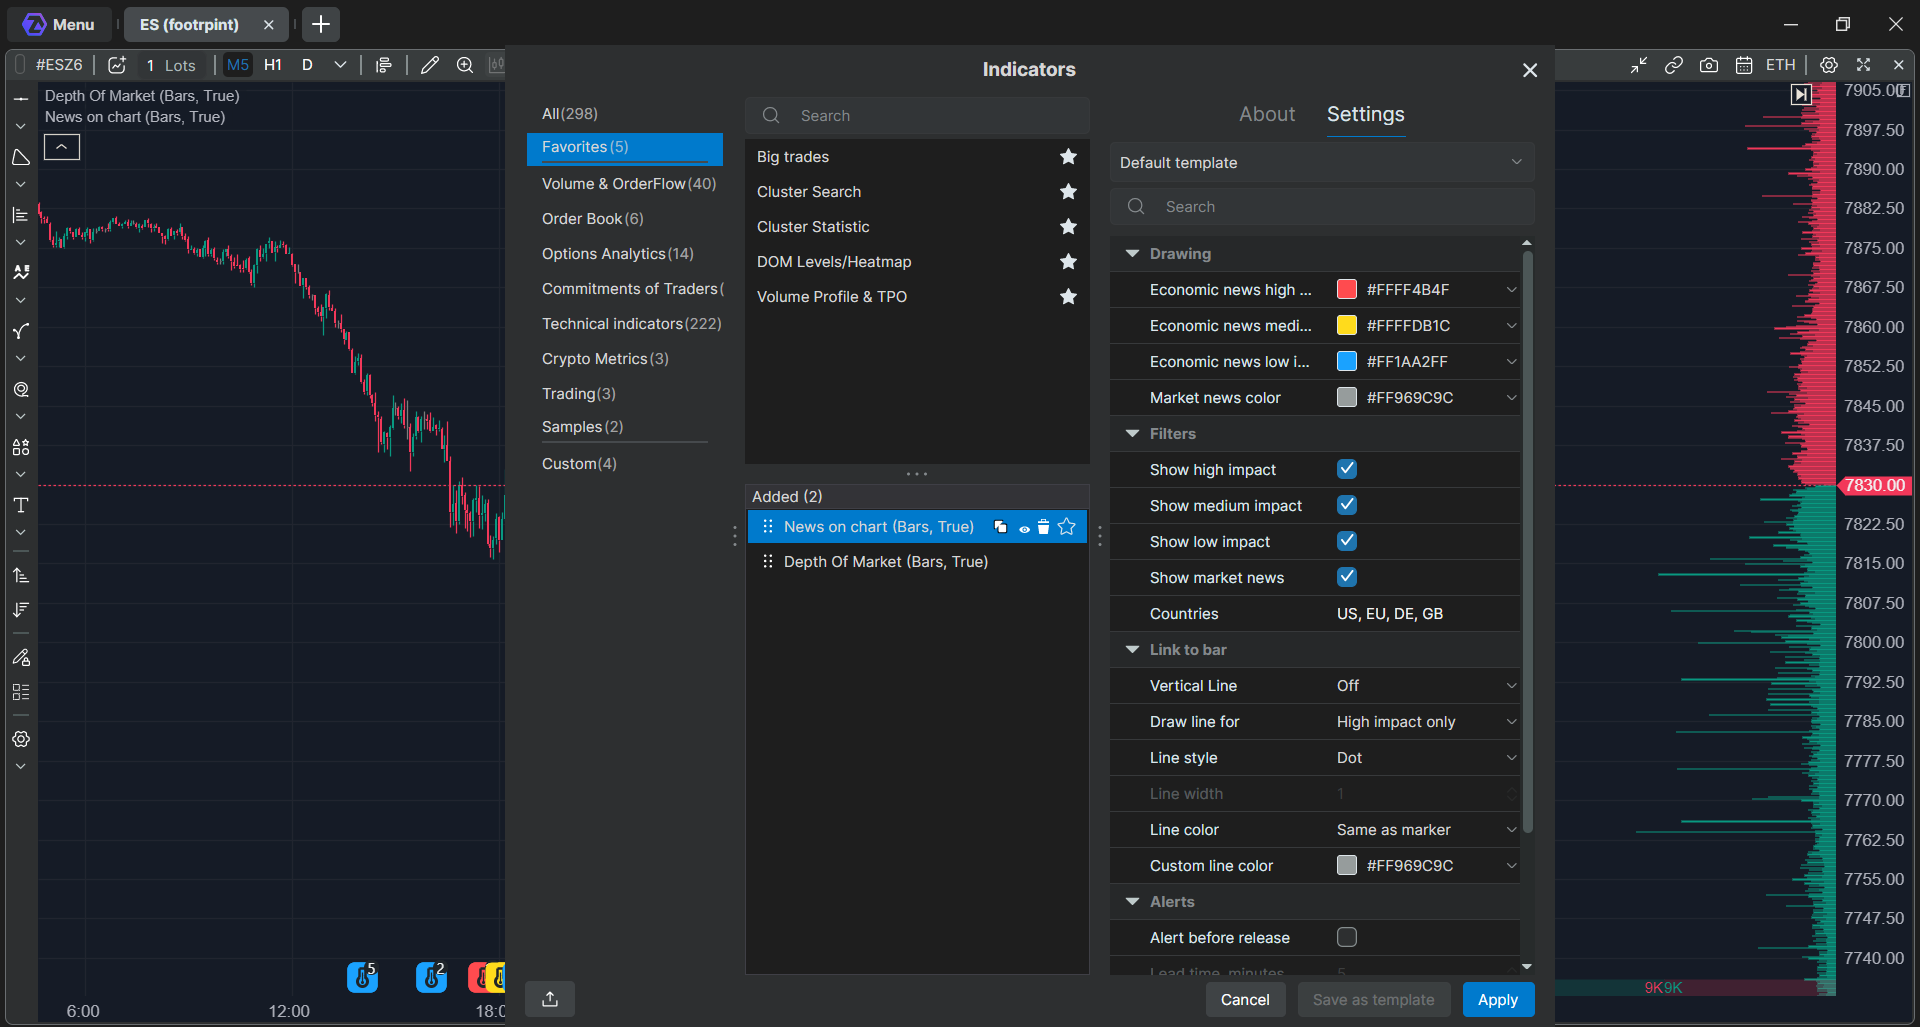
| Setting | What it does |
| Show high impact | Shows high-impact events. On by default. |
| Show medium impact | Shows medium-impact events. On by default. |
| Show low impact | Shows low-impact events. Off by default, because most calendar events are low impact and would crowd the time scale. On stocks, turn it on to see earnings reports and paid dividends. |
| Show market news | Shows events without numeric figures, such as speeches and statements, as well as company news headlines. On by default. |
| Countries | Shows economic events only for the listed countries. Enter country codes separated by commas, for example US, EU. Leave the field empty to show all countries. |
If you turn off all impact levels and market news, the indicator draws nothing.
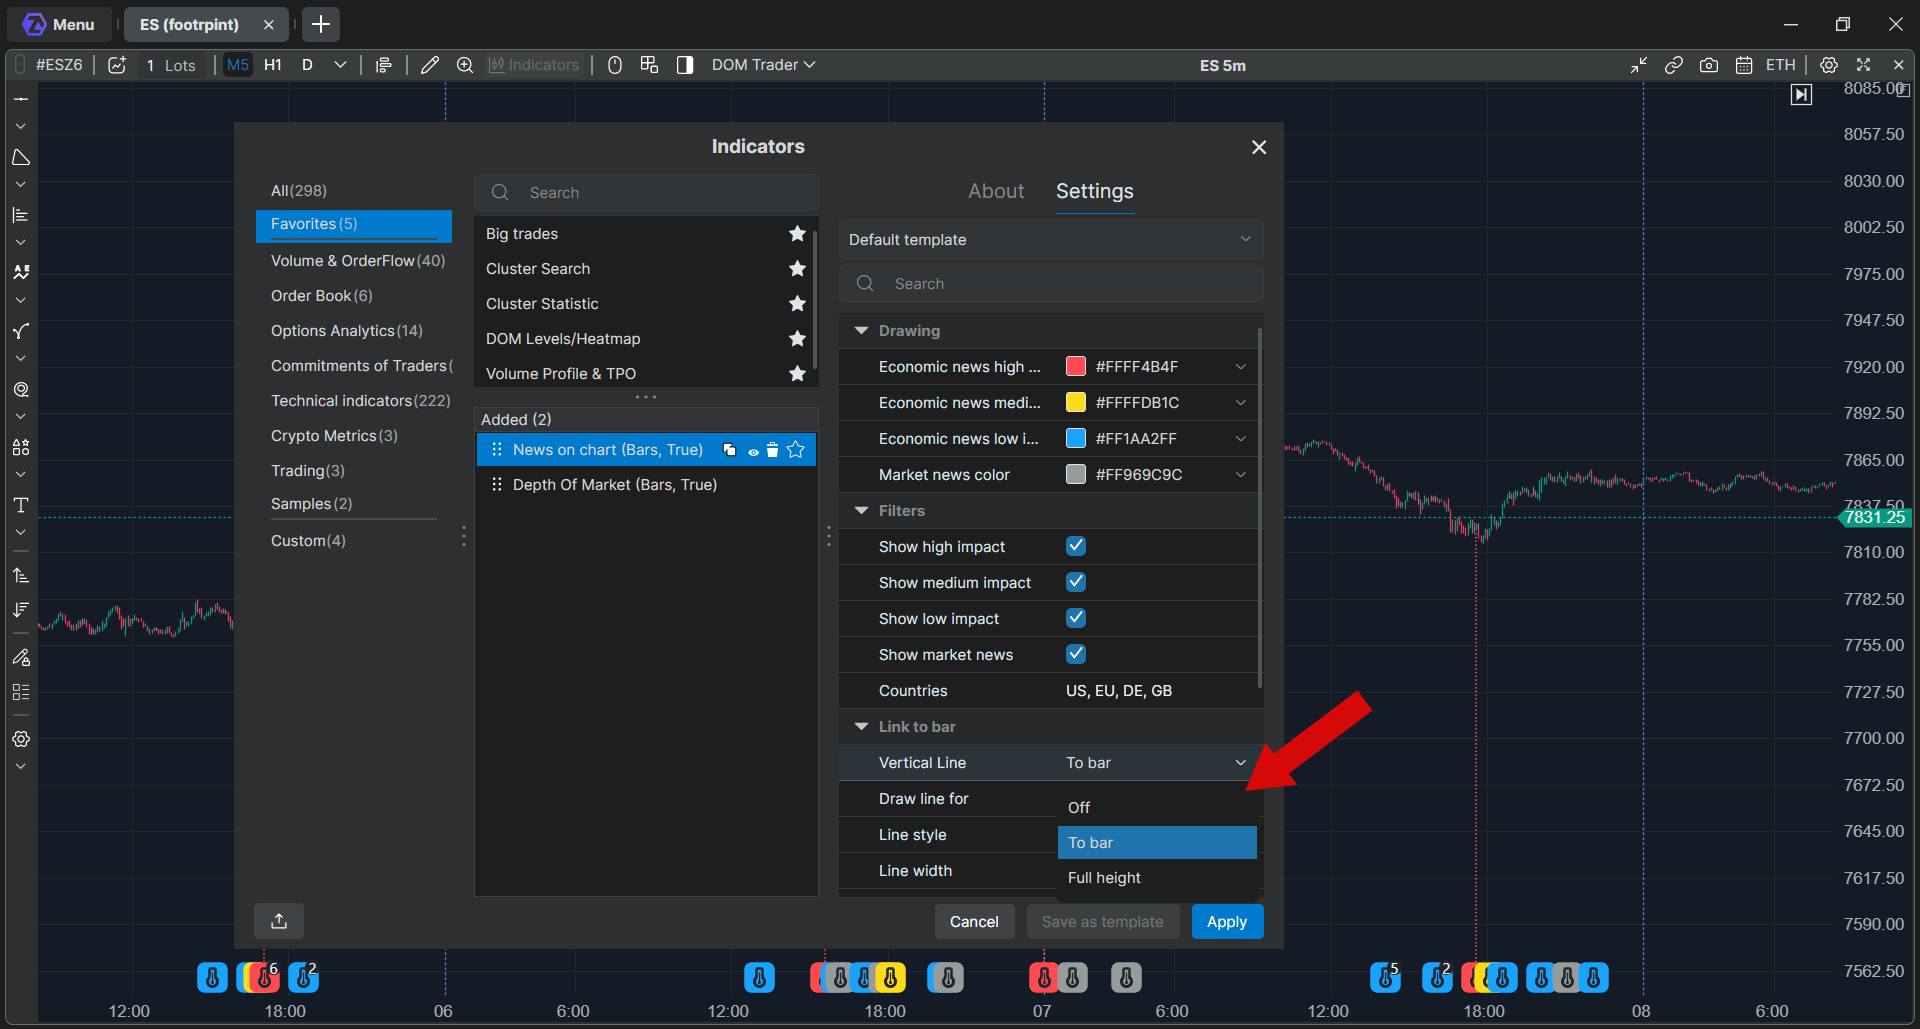
Link to bar
| Setting | What it does |
| Vertical line | Draws a line from the icon up to its bar. Off: no line (default). To bar: the line stops at the low of the bar. Full height: the line crosses the whole chart. For upcoming events there is no bar yet, so the line goes to the top of the chart. |
| Draw line for | High impact only (default) or All news. Available when Vertical line is not Off. |
| Line style | Line type. Dotted by default. |
| Line width | From 1 to 10. Default: 1. |
| Line color | Same as marker (default): the line takes the colour of the icon. Custom: the line uses the colour from Custom line color. |
| Custom line color | The line colour when Line color is set to Custom. |
Alerts
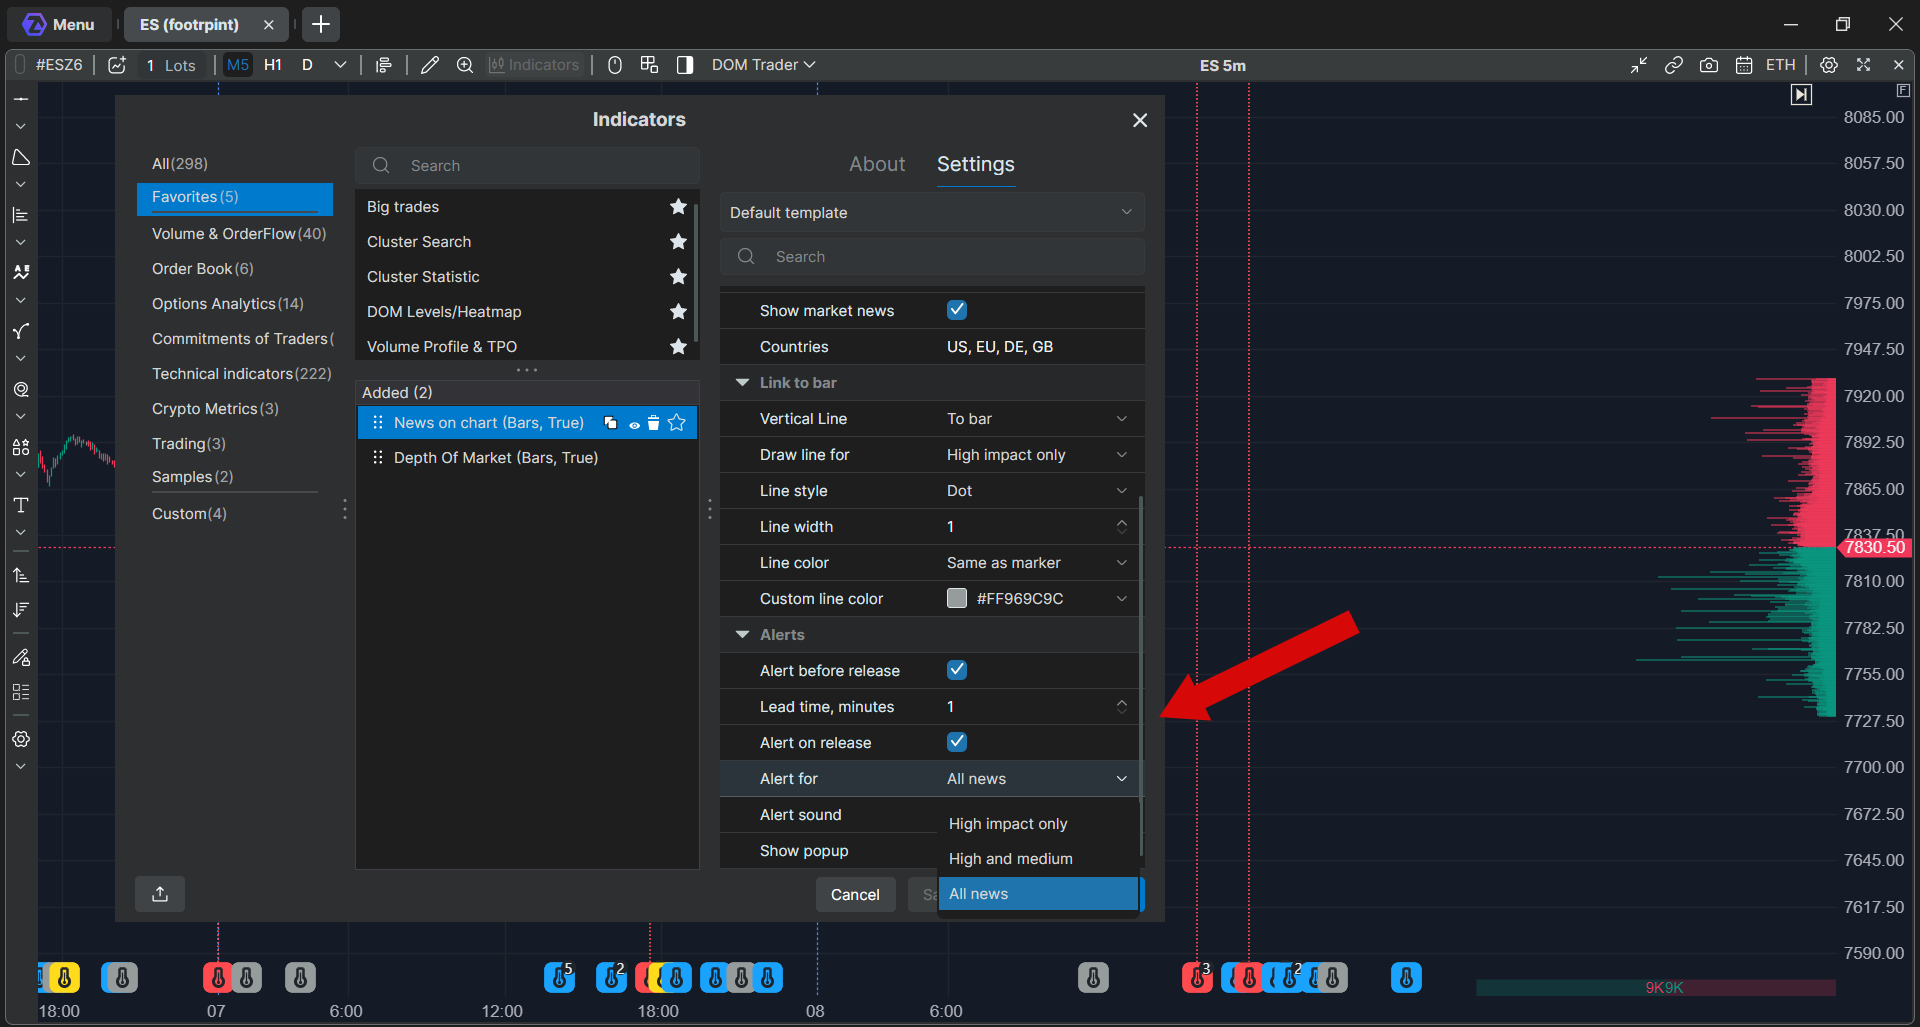
| Setting | What it does |
| Alert before release | Plays a sound before a scheduled economic release. Off by default. |
| Lead time, minutes | How many minutes before the release the sound plays: from 1 to 120. Default: 5. Available when Alert before release is on. |
| Alert on release | Plays a sound when the event comes out. Off by default. Works independently of Alert before release: you can turn on one or both. |
| Alert for | Which events trigger a sound: High impact only (default), High and medium or All news. Events without figures, such as speeches, trigger a sound only with All news. |
| Alert sound | The sound file for alerts. |
| Show popup | Shows a window with the event name, time and importance together with the sound. On by default. |
How alerts work:
- Alert for does not depend on the display filters. For example, you can hide medium-impact events from the chart and still get a sound for them.
- The Countries filter applies to alerts too: there is no sound for countries that are not in the list.
- If several events come out at the same minute, you get one alert. The window shows the most important event and how many more there are, for example US CPI (+2) | 15:30 | High.
- Each release triggers its alert once, even if the indicator is on several charts.
- Alerts work only while the platform is running and a chart with the indicator is open.
Drawing
| Setting | What it does |
| Economic news high importance color | Colour of high-impact events. Red by default. |
| Economic news medium importance color | Colour of medium-impact events. Yellow by default. |
| Economic news low importance color | Colour of low-impact events. Blue by default. |
| Market news color | Colour of market news. Grey by default. |
If Something Goes Wrong
| Problem | What to check |
| News on Chart is not in the indicator list | The indicator is not enabled for your account yet. Contact support. |
| The indicator is added, but there are no icons | Check the instrument: icons appear on CME futures and on NASDAQ and NYSE stocks only. Then check the filters: at least one impact level or Show market news must be on, and the Countries field must include US or be empty. |
| No earnings or dividends on a stock chart | Turn on Show low impact. Earnings reports and paid dividends are shown as low-impact events. |
| No upcoming events | Upcoming events appear to the right of the last bar. Scroll the chart to the right to see them. |
| Actual is empty after the release time | The value usually appears within a few minutes after publication. If the event shows a dash for Forecast and Previous too, the calendar has no figures for it. |
| No sound before or at a release | Make sure Alert before release or Alert on release is on, the event's importance matches Alert for, and its country is in the Countries list. The platform must be running with a chart that has the indicator. |
| A headline does not open | The article opens in your default browser. Check that a default browser is set in Windows. |
Was this article helpful?
That’s Great!
Thank you for your feedback
Sorry! We couldn't be helpful
Thank you for your feedback
Feedback sent
We appreciate your effort and will try to fix the article