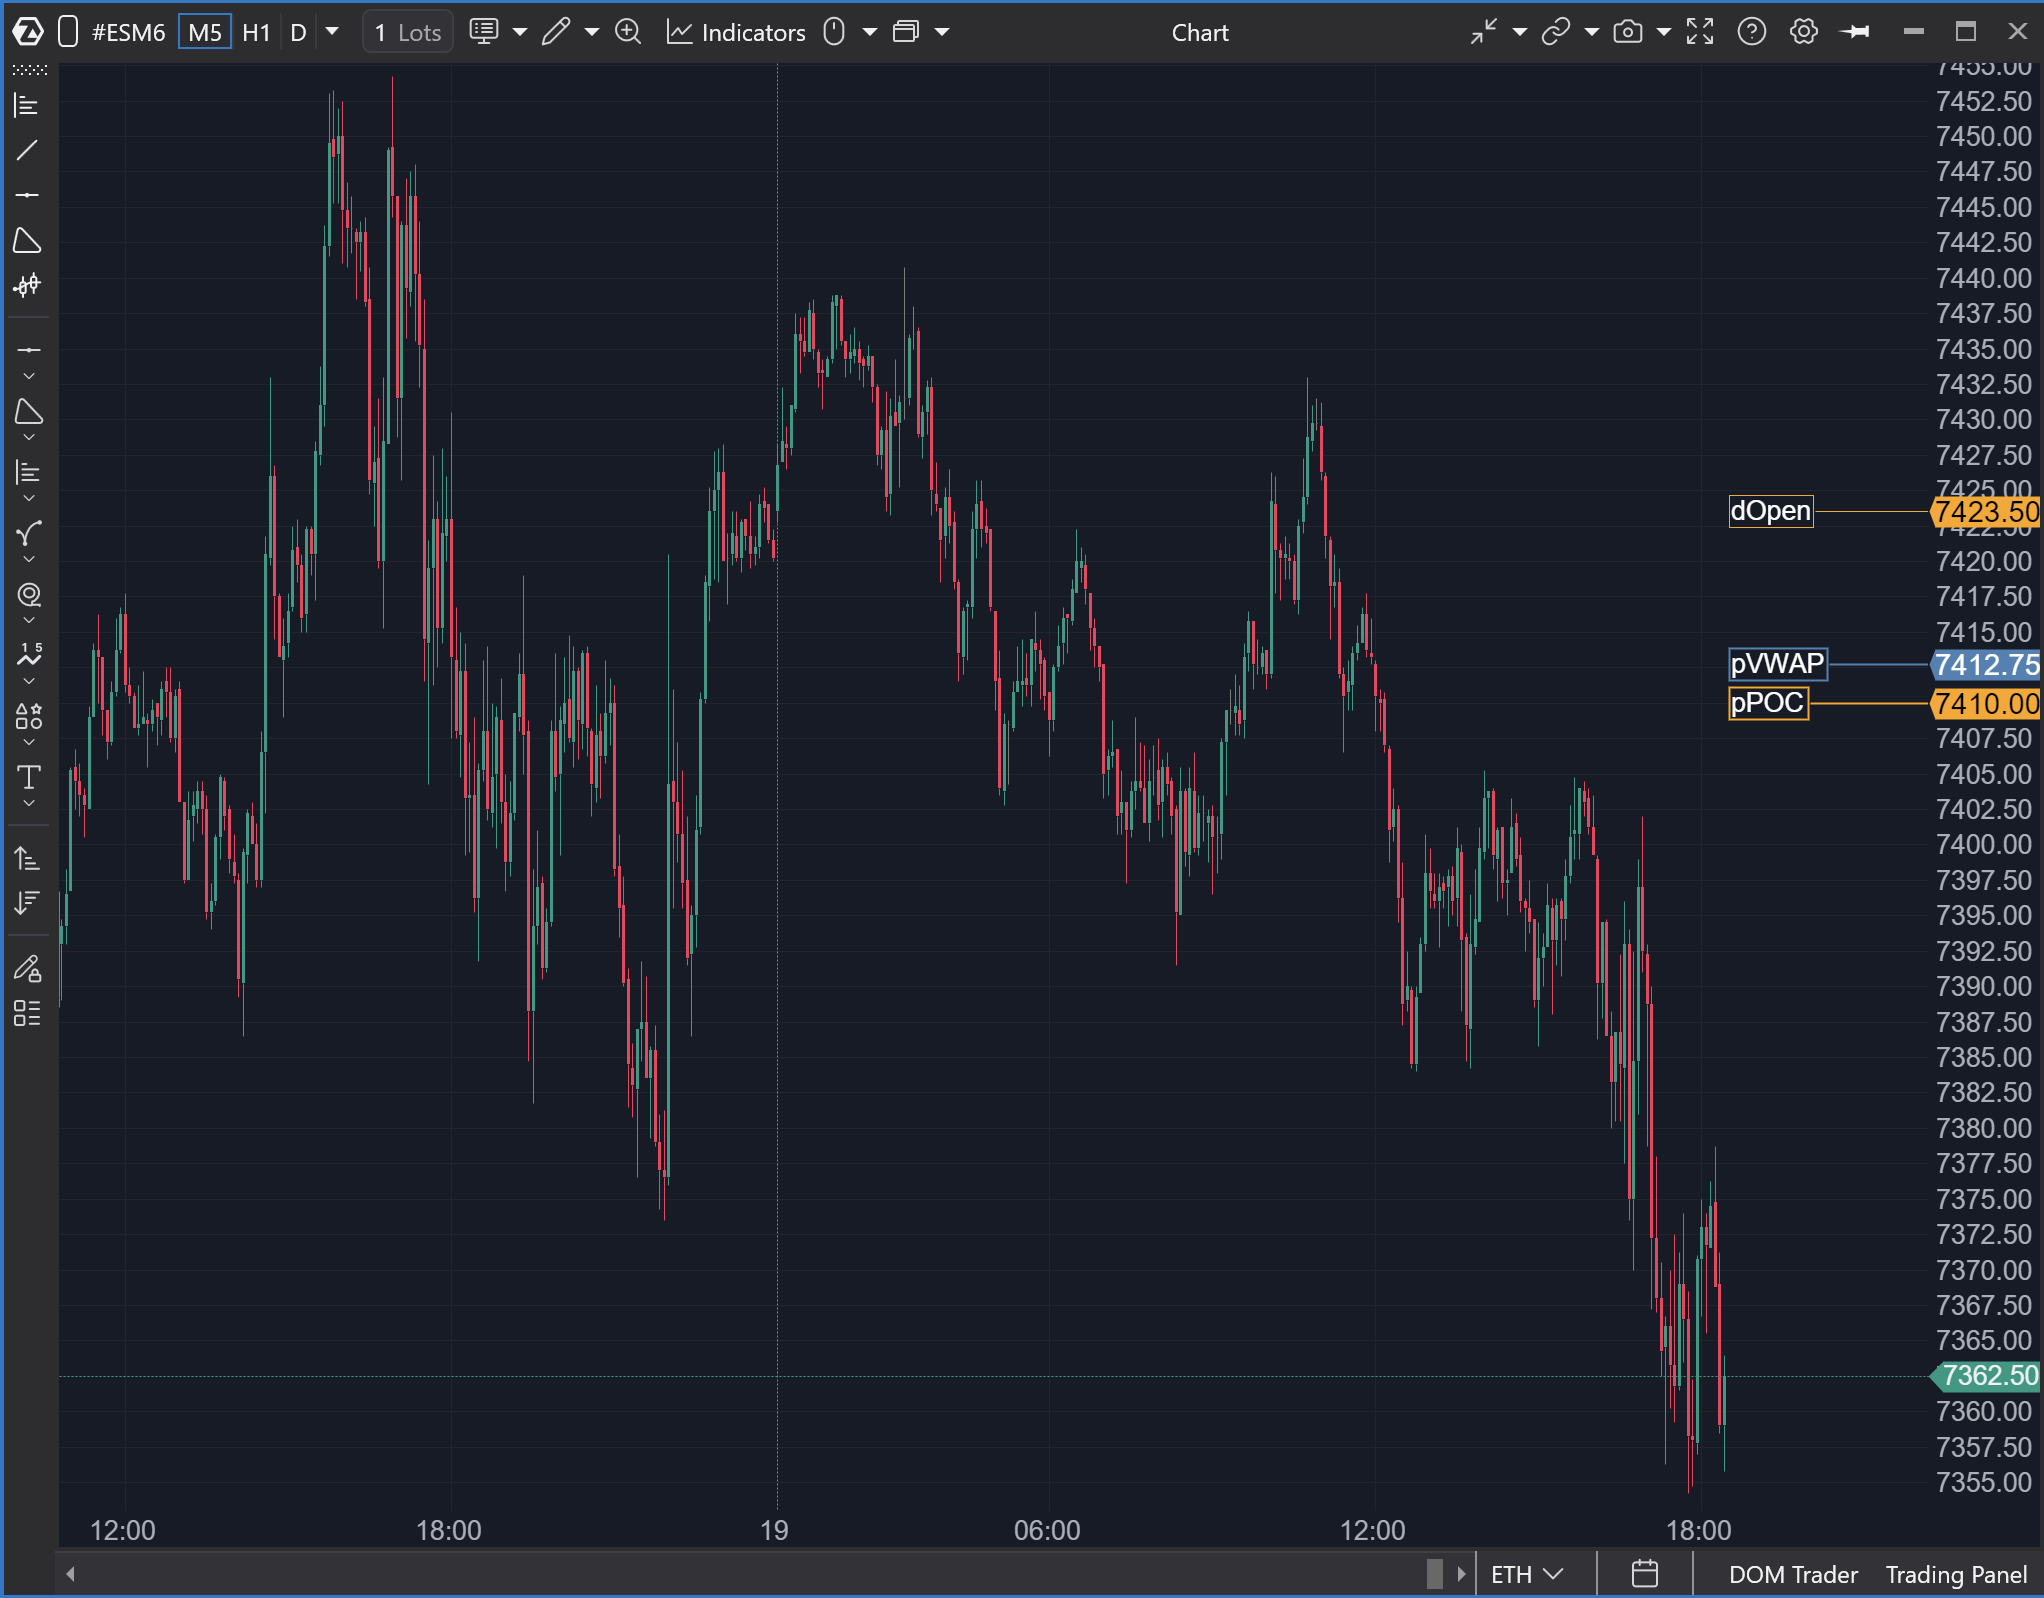
The OHLC Plus indicator displays key price and volume profile levels for multiple trading periods directly on the chart. It helps compare the current market price with important reference levels from the current or previous day, week, month, or contract.
Use this indicator when you want to analyze how price behaves relative to historical Open, High, Low, Close, POC, VWAP, Value Area, and Equilibrium levels.
How the Indicator Works
OHLC Plus calculates and displays levels for the selected trading periods. Each period has its own group of settings, allowing you to enable only the levels required for your analysis.
The indicator supports the following periods:
- Current Day
- Previous Day
- Current Week
- Previous Week
- Current Month
- Previous Month
- Contract
Available Levels
Each period contains the same set of available levels:
- Open — opening price of the selected period.
- High — highest traded price.
- Low — lowest traded price.
- Close — closing price of the selected period.
- Equilibrium — midpoint between the High and Low.
- POC — Point of Control, the price with the highest traded volume.
- VWAP — Volume Weighted Average Price.
- VAH — Value Area High.
- VAL — Value Area Low.
Level Settings
Each level can be configured independently.
- Enabled — shows or hides the selected level.
- Color — changes the color of the line and its label.
- Show Price — displays the price label on the price scale.
- Line — defines how the level is drawn: None, Till Bar, or Full Width.
- Width — sets the line thickness.
- Line Style — selects the line style (solid, dashed, dotted, etc.).
- Label — defines where the level label is displayed: None, Bar, Left, or Right.
Default Configuration
By default, the indicator displays:
- Current Day Open
- Previous Day POC
All other levels are available in the indicator settings and can be enabled individually.
Visibility Hotkey
The indicator includes the Toggle Levels Visibility Hotkey setting.
By default, the assigned hotkey is Q. Pressing this key hides or shows all OHLC Plus levels without changing the indicator configuration.
Tips
- Enable only the levels that are important for your trading workflow to keep the chart readable.
- Use different colors or line styles to distinguish current-period levels from previous-period levels.
- If profile-based levels such as POC, VWAP, VAH, or VAL are not displayed, verify that sufficient volume profile data is available for the selected instrument and period.
Was this article helpful?
That’s Great!
Thank you for your feedback
Sorry! We couldn't be helpful
Thank you for your feedback
Feedback sent
We appreciate your effort and will try to fix the article