Visual Settings
The Visual Settings tab in chart settings controls how the chart looks and how visual chart elements behave.
Use this tab to adjust the chart background, current price line, crosshair, grid, axes, candles, bars, line chart style, session display, drawing object behavior, volume display, and chart update settings.
These settings affect the selected chart only. They do not change the trading account, market data source, or indicator calculation logic.
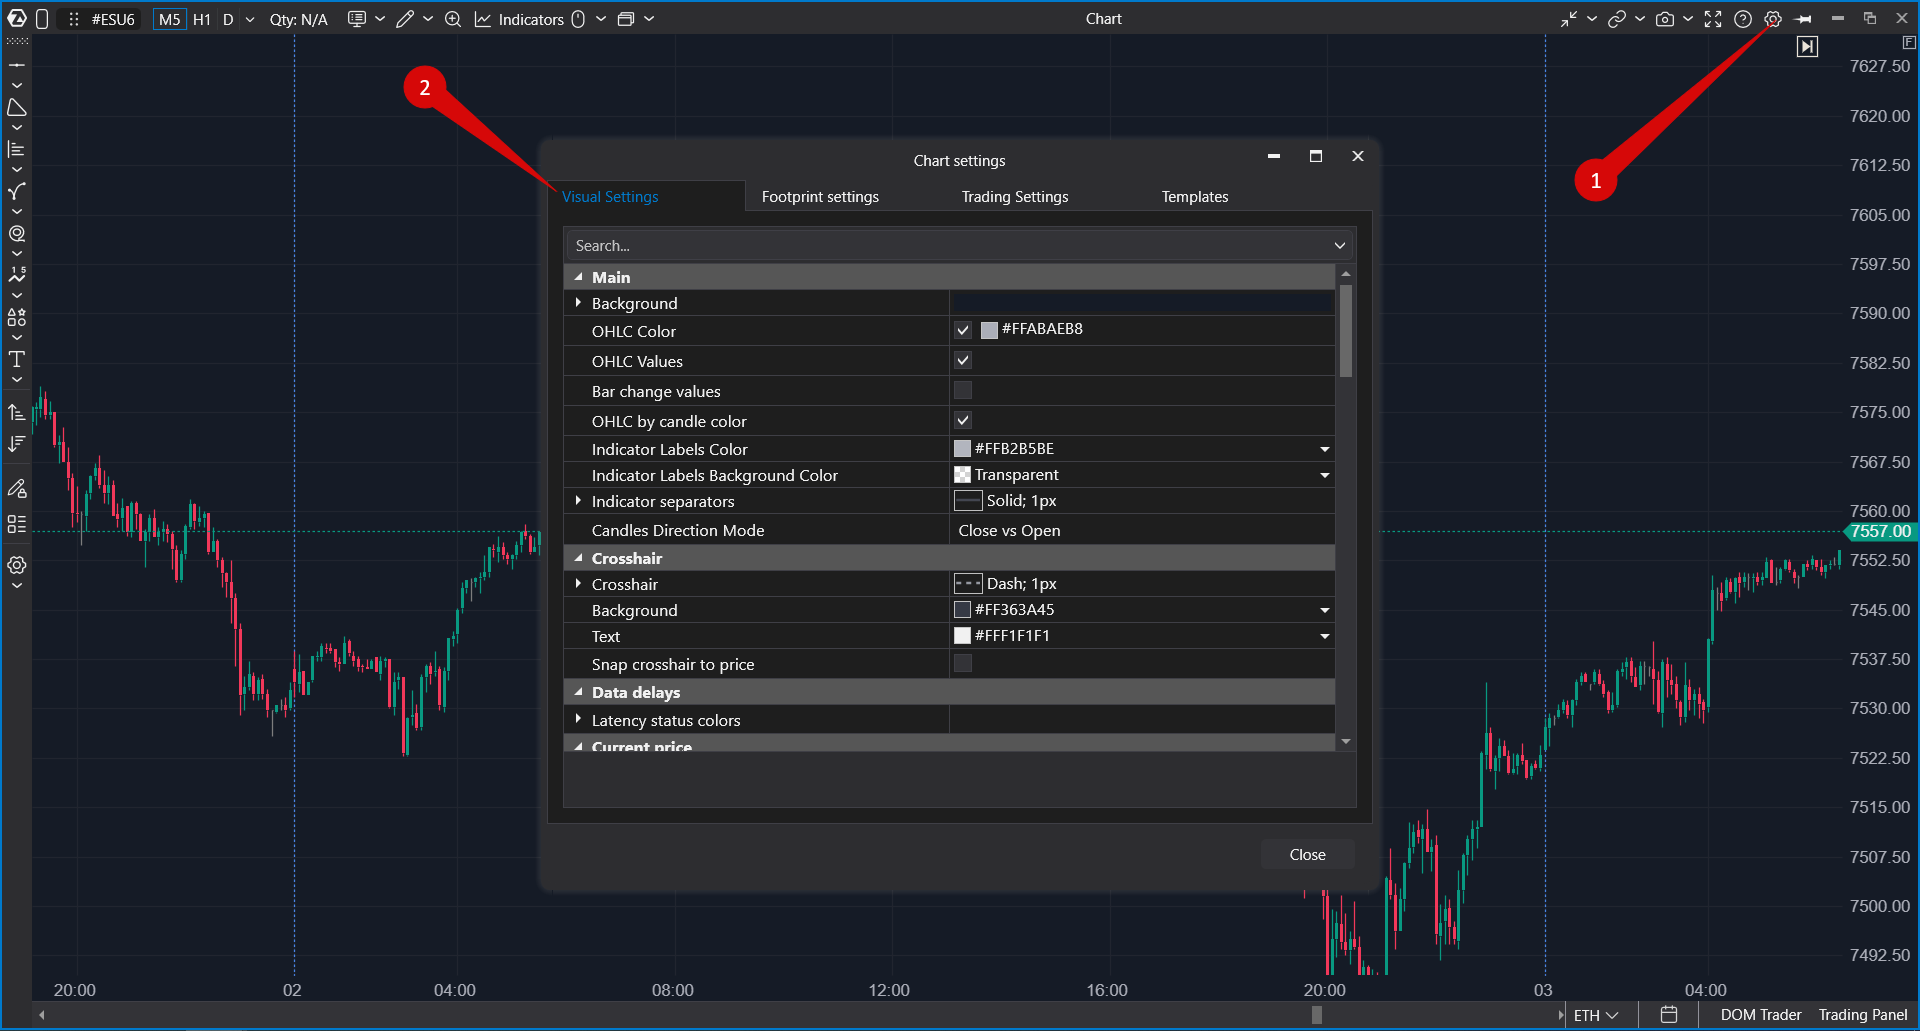
Opening Visual Settings
- Open a chart.
- Open the chart context menu or chart settings menu.
- Select Settings.
- Open the Visual Settings tab.
The Visual Settings tab is available together with other chart configuration tabs, such as cluster settings, trading settings, and templates.
Main
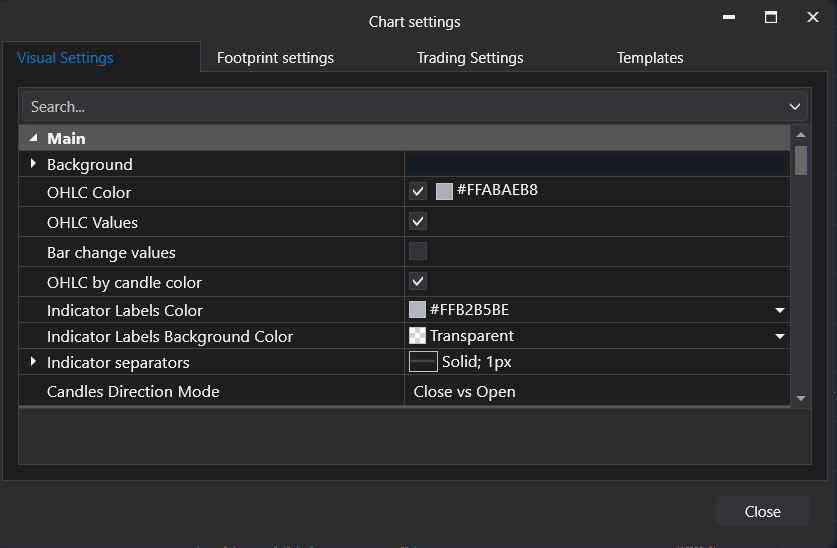
The Main group contains general chart appearance settings.
- Background — sets the chart background color or gradient.
- OHLC Color — sets the color for OHLC values.
- Indicator Labels Color — sets the text color for indicator labels.
- Labels Background — sets the background color for labels.
- Indicator Separators — controls the style of separator lines between chart panels.
- Candles Direction Mode — defines how candle direction is determined for coloring and visual state.
Current Price
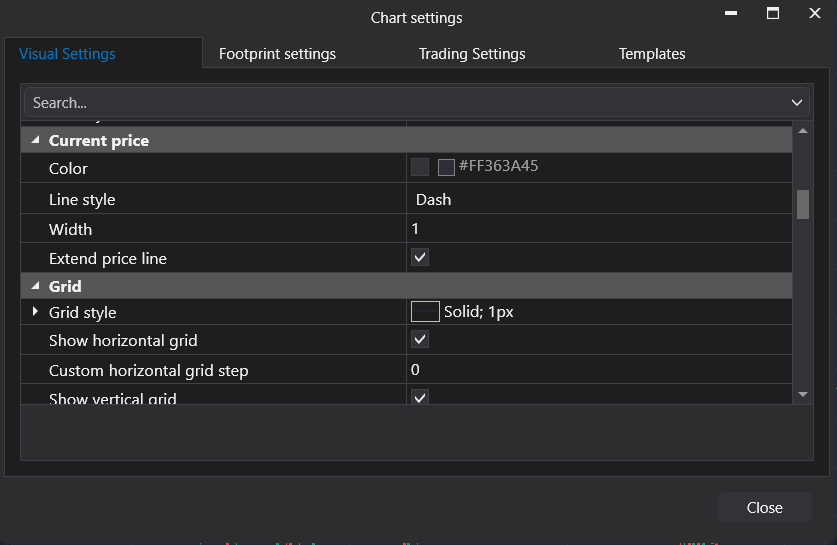
The Current Price group controls how the current price line is displayed on the chart.
- Color — sets the current price line color.
- Line Dash Style — changes the line style, for example solid or dashed.
- Width — changes the line thickness.
- Extend Price Line — extends the current price line across the chart.
Use these settings when you want the current price to be more visible or less distracting.
Crosshair
The Crosshair group controls the appearance and behavior of the chart crosshair.
- Crosshair — sets the crosshair line style.
- Background — sets the background color of the price and time labels shown by the crosshair.
- Text — sets the text color of crosshair labels.
- Snap Crosshair to Price — makes the crosshair align with valid price levels.
Use Snap Crosshair to Price when you want the crosshair to follow instrument price increments more precisely.
Grid
The Grid group controls chart grid lines and session separators.
- Grid Style — sets the color and style of grid lines.
- Show Horizontal Grid — shows or hides horizontal grid lines.
- Custom Horizontal Grid Step — sets a custom distance between horizontal grid lines.
- Show Vertical Grid — shows or hides vertical grid lines.
- New Session Lines Style — controls the style of lines that separate trading sessions.
Axis
The Axis group controls the appearance of chart axes.
- Axis Background Color — sets the axis background color.
- Axis Text Color — sets the color of axis labels.
- Font Size — changes the size of text on the axis.
- Time Format — controls how time is displayed on the time axis.
- Draw Borders — shows or hides axis borders.
Use these settings to improve readability, especially on small screens or dense workspaces.
Candles
The Candles group controls the visual style of candle charts.
- Up Candle Color — sets the color of upward candles.
- Down Candle Color — sets the color of downward candles.
- Draw Candle Border — enables or disables candle borders.
- Candle Border Color as Body — uses the candle body color for the border.
- Candles Border — sets a custom border color.
- Candle Border Width — changes candle border thickness.
These settings affect candle appearance only. They do not change candle calculation or market data.
Bars
The Bars group controls the visual style of bar charts.
- Bar Width — changes the width of bars.
- Doji Bar Color — sets the color for doji bars.
- Down Bar Color — sets the color for downward bars.
- Up Bar Color — sets the color for upward bars.
- Show Open — shows or hides the open mark on bars.
- Show Close — shows or hides the close mark on bars.
Line Chart
The Line Chart group controls the style of the line used in Line Chart mode.
- Color — sets the line color and style.
Session Time
The Session Time group allows you to define a custom visible session time for the chart.
- Custom Session Time — enables or disables a custom session time range.
- Session Begin — sets the start time of the custom session.
- Session End — sets the end time of the custom session.
Use this group when you want the chart to focus on a specific trading session instead of displaying the full available time range.
Volume Visualization
The Volume Visualization group controls how volume values are displayed.
- Minimize Values — shortens large volume values for easier reading.
- Digits After Comma — sets the number of decimal digits shown for volume values.
- Volumes in USDT — displays crypto volume values in USDT when the instrument and chart support this option.
Drawing Objects
The Drawing Objects group controls how drawing tools behave and how selected objects are highlighted.
- Keep Selected Objects — keeps drawing objects selected after interaction.
- Selection Background Color — sets the background highlight color for selected objects.
- Selection Color — sets the main selection color.
- Magnet Sensitivity — controls how strongly drawing tools snap to nearby chart values.
Use these settings if you actively work with drawing tools, levels, rays, or other chart annotations.
Other Settings
The Other group contains additional chart behavior settings.
- Indicators Values on Mouse Over — shows indicator values when the mouse is over the chart.
- Auto Transform Candles to Footprint — automatically switches candles to Footprint when candles become wide enough.
- Candle Size to Transform to Footprint — sets the candle size threshold for automatic transformation.
- Hide Footprint Panel — hides the Footprint panel when applicable.
- Auto Transform Horizontal Lines — adjusts horizontal line display automatically.
- Auto Transform Vertical Lines — adjusts vertical line display automatically.
- Price Offset — changes the horizontal offset near the price area.
- Chart Vertical Offset — changes the vertical chart offset.
- Smoothing — enables smoother chart rendering.
- Mouse Wheel Behavior — defines whether the mouse wheel zooms, scrolls, or zooms both axes.
- Leave Ruler on Mouse Release — keeps the ruler visible after releasing the mouse.
- Show Indicators List — shows or hides the list of indicators on the chart.
Update Intervals
The Update Intervals group controls chart rendering optimization and custom update frequency.
- Use Optimization Mode — enables optimized chart rendering behavior.
- Use Custom Update Intervals — allows you to define custom chart update intervals.
- Chart Custom FPS — sets the chart update range when custom update intervals are enabled.
Use these settings carefully. Lower update frequency may reduce system load, while higher update frequency may make chart updates smoother but can require more resources.
Important Notes
- Visual Settings are chart-specific and can be saved with chart templates or workspaces.
- Visual Settings do not change the selected instrument, account, connection, order behavior, or indicator formulas.
- Some settings are most visible only in specific chart modes, such as Candles, Bars, Line Chart, Mountain Chart, or Footprint.
- If a setting does not seem to affect the current chart, check whether the selected chart type uses that visual element.
Was this article helpful?
That’s Great!
Thank you for your feedback
Sorry! We couldn't be helpful
Thank you for your feedback
Feedback sent
We appreciate your effort and will try to fix the article