Price Change — real-time visualization of market volatility and price movement intensity
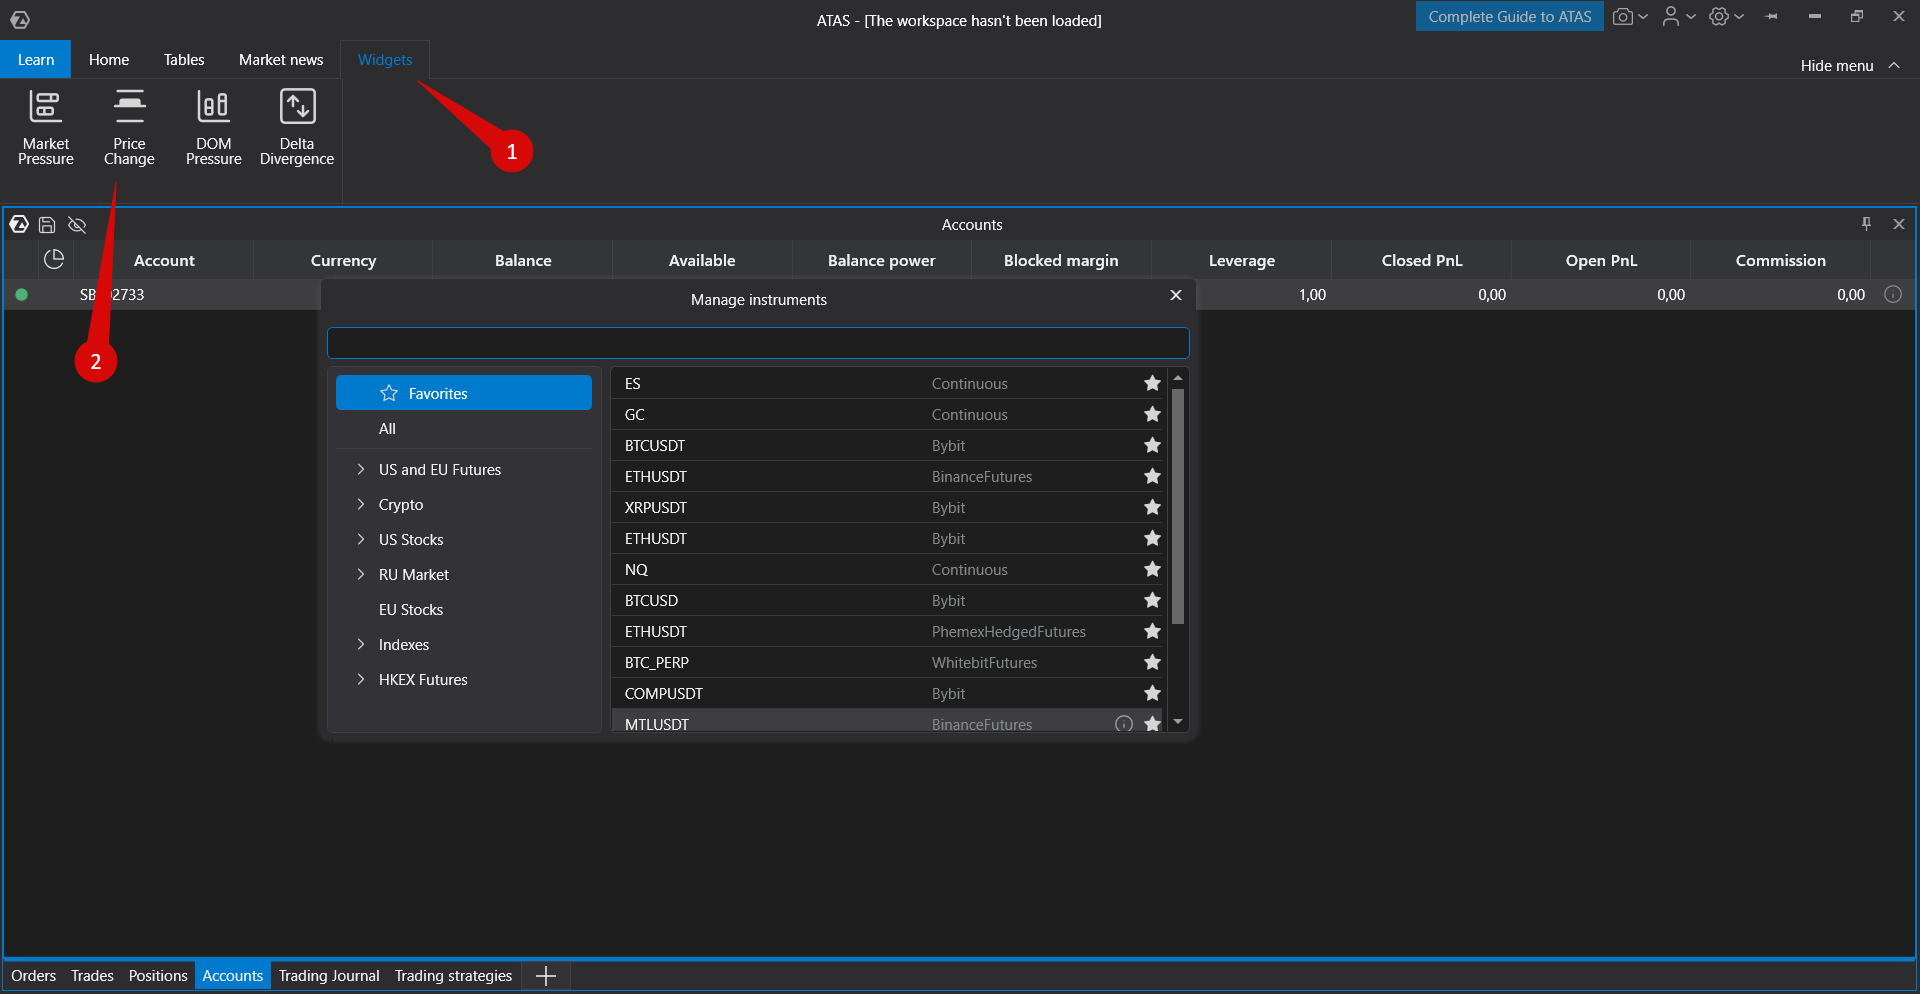
To open the Price Change widget, select Widgets → Price Change.
The Price Change widget is an innovative tool for analyzing volatility and price changes of an instrument in real time. It visualizes the intensity of price movements on a scale from -100 to +100, where values above the threshold level indicate increased market activity.

Why Traders Need It
Key Advantages
1. Early Volatility Detection
Detects rising market activity before it becomes visible on the chart.
Helps enter positions at the beginning of strong moves.
2. Risk Management
Alerts traders to sudden price changes using sound notifications.
Helps adjust position size based on current volatility.
3. Improved Trade Timing
Identifies optimal entry and exit points.
Helps avoid entering sideways or low-volatility markets.
4. Market Adaptability
Automatically adjusts to changing market volatility.
Uses historical data to calibrate indicator readings.
Practical Use Cases
Scalping: Detect micro price movements quickly.
Day Trading: Identify breakout and trending conditions.
Risk Management: Monitor changing volatility to adjust stop-loss levels.
News Trading: React instantly to volatility spikes following major events.
Main Settings
Calculation Group

Mode — calculation method (Standard Deviation or Rate of Change).
Period — analysis interval (10 seconds to 5 minutes).
Training Period — learning period (5 minutes to 1 hour).
Threshold — alert trigger level (10–100).
Colors Group

Background — widget background color.
Price Up — color for positive values (green).
Price Down — color for negative values (red).
Text Color — primary text color.
Secondary Text Color — secondary text color.
Grid — color of grid and layout lines.
Alerts Group
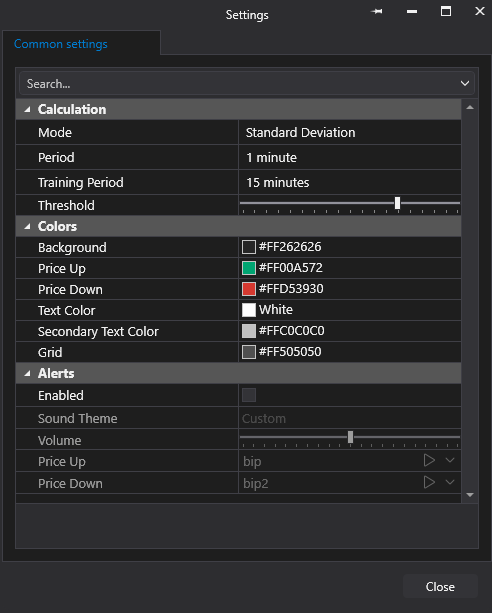
Enabled — enable or disable sound alerts.
Audio Theme — select a sound theme.
Sound Volume — set the sound level (0–100%).
Price Up — sound file for positive price changes.
Price Down — sound file for negative price changes.
Widget Interface
Main Elements
Display Mode — shows the current calculation mode.
Value Scale — ranges from -100 to +100.
Central Indicator — displays the current price change value.
Threshold Lines — indicate the configured threshold level.
Percentage Display — numeric representation of the current change.
Instrument Price — displays the current price of the selected instrument.
Widget States
Loading — animated dots with the message "Loading data".
Training — historical data analysis is in progress.
Active — normal operation displaying current readings.
Test Mode — used to verify alert sounds.
Data Interpretation
Indicator Values
0 — no significant price change.
+1 to +25 — slight increase in activity.
+25 to +50 — moderate increase in activity.
+50 to +75 — strong market activity.
+75 to +100 — extremely high volatility.
Negative values — represent price decreases with the same intensity scale.
Color Indication
Green — positive price change.
Red — negative price change.
White — neutral state near zero.
Sliding Window Principle
The widget uses a two-period normalization system to adaptively display market changes.
How It Works
Two key parameters are used:
Measurement Window — the period used to calculate the current value.
Normalization Window — the period used to determine the display scale.
Algorithm:
Calculate the current change: Every second, the system calculates the price change over the selected measurement window.
Determine the maximum: The system analyzes all changes within the normalization window and identifies the largest deviation.
Normalize the visualization: The current value is displayed relative to the detected maximum.
Example:
Maximum change over 10 minutes = 5%
Current change = 1%
Widget indication = 20% (1% ÷ 5% × 100%).
Advantage
The widget automatically adapts its display scale to current market volatility, ensuring clear and intuitive visualization under any trading conditions.
Was this article helpful?
That’s Great!
Thank you for your feedback
Sorry! We couldn't be helpful
Thank you for your feedback
Feedback sent
We appreciate your effort and will try to fix the article