Market Pressure — real-time visualization of buyer and seller pressure
The Market Pressure indicator provides traders with real-time visualization of buyer and seller pressure in the market. This tool helps to identify current market dynamics and moments of aggressive trading activity as they occur.
General Description
The Market Pressure widget continuously monitors all trades and calculates the total pressure from buyers and sellers using exponential decay:
MarketPressure(t) = Σ [ EventWeight × e^(−TimeDelta / HalfLifePeriod) ]
Recent trades have a greater impact on the pressure calculation, while older ones gradually fade. This creates a dynamic representation of the current market condition.
Analysis Modes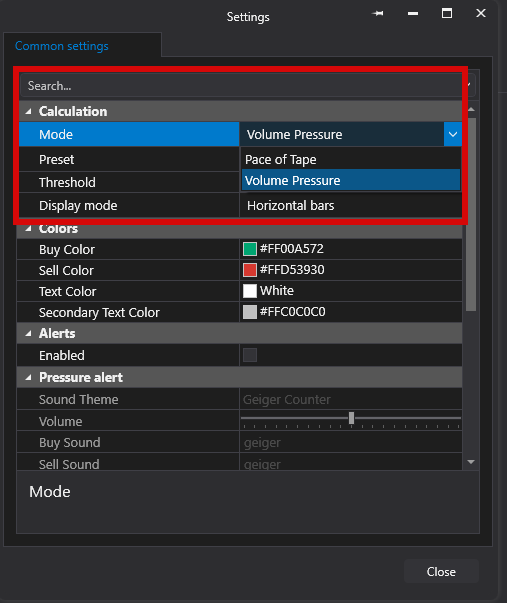
1. Volume Pressure (VP)
- Weights each trade by its volume.
- Larger trades create more pressure.
- Optimal for identifying institutional activity and significant market moves.
2. Pace of Tape (POT)
- Counts the number of trades regardless of their size.
- Each trade contributes equally to the pressure calculation.
- Useful for detecting high trading activity and urgency in the market.
Visual Display
Pressure Bars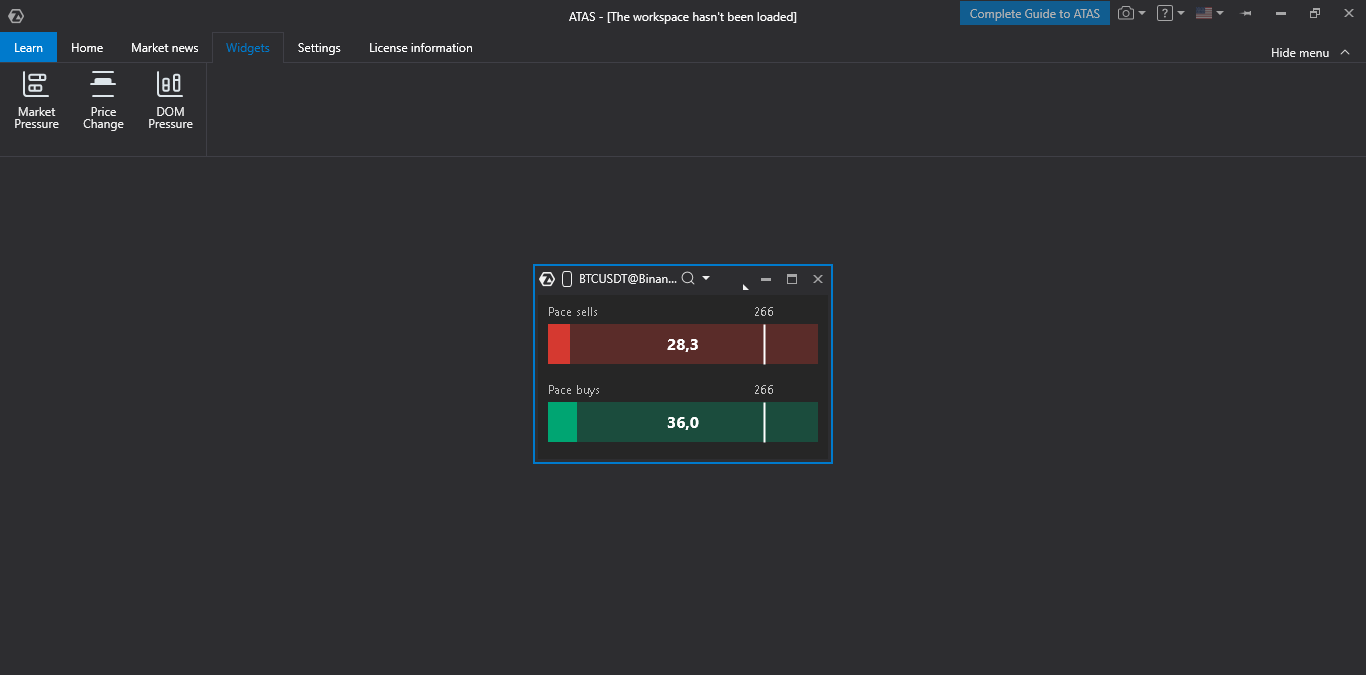
- Green bar — represents buying pressure (aggressive buyers).
- Red bar — represents selling pressure (aggressive sellers).
- Bars fill from left to right as pressure increases.
- The current pressure value is displayed in the center of each bar.
Threshold Line
- The vertical line shows the set threshold level.
- The threshold value is displayed above the line.
- Helps quickly identify when the pressure reaches a significant level.
Smart Number Formatting
- Large values are automatically abbreviated (e.g., 1.5k, 1.5M).
- Ensures a clean and easy-to-read display of data.
Configuration Parameters
Time Sensitivity
| Short (10s half-life) | Very sensitive to recent trades, training period — 5 minutes. |
| Medium (30s half-life) | Balanced sensitivity, training period — 15 minutes. |
| Long (1min half-life) | Provides a longer-term view of pressure, training period — 1 hour. |
Threshold Setting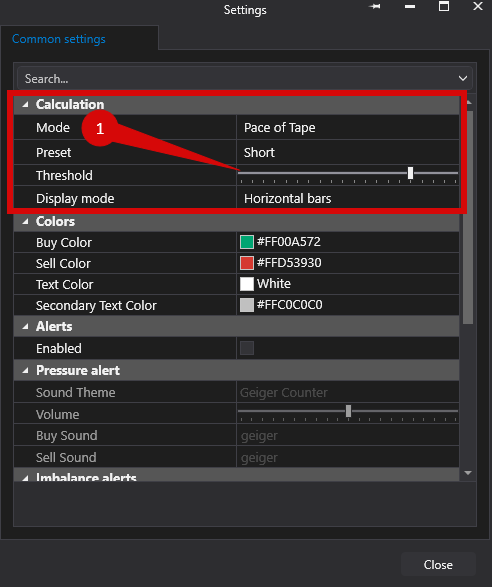
- Allows you to set the percentage threshold level (default is 50%).
- Values above the threshold typically indicate strong market pressure.
Visual Customization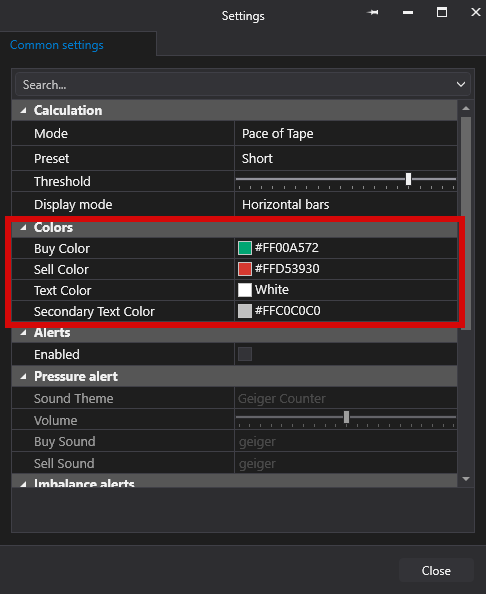
- Change the colors used to display buyer and seller pressure.
- Adjust the opacity of the bars and background.
Alerts
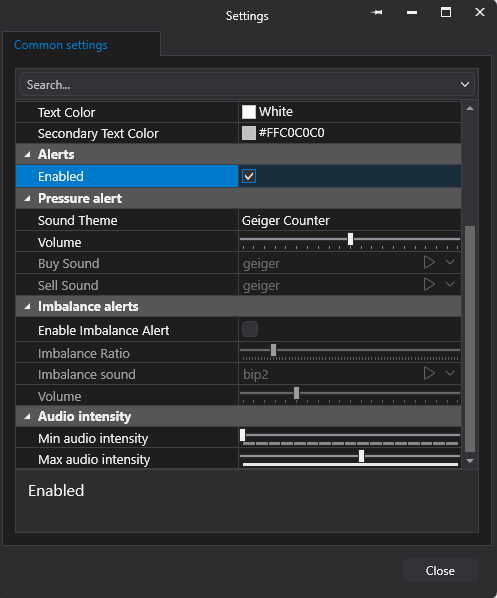
Alerts- enabled
Pressure alert
Sound Theme — Geiger Counter
Volume
Buy Sound — geiger
Sell Sound — geiger
Imbalance alerts
Enable Imbalance Alert
Imbalance Ratio
Imbalance sound — bip2
Volume
Audio intensity
Min audio intensity
Max audio intensity
How to Use
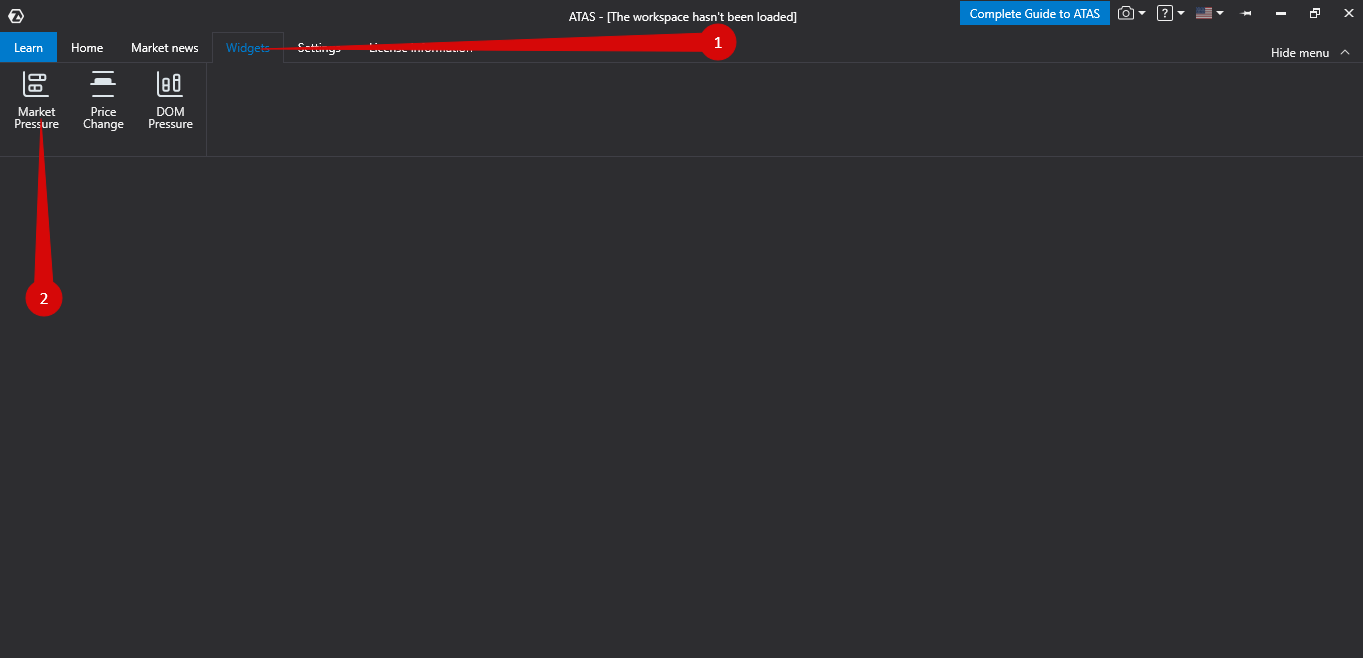
- Add the Market Pressure widget to your workspace from the widget panel.
- Select an instrument — the widget works with all supported exchanges and instruments.
- Select the time sensitivity mode (Short / Medium / Long).
- Set the threshold level according to your trading strategy.
- Monitor the bars — look for pressure spikes and imbalances between buyers and sellers.
- Switch between VP and POT modes to get different analytical perspectives.
Was this article helpful?
That’s Great!
Thank you for your feedback
Sorry! We couldn't be helpful
Thank you for your feedback
Feedback sent
We appreciate your effort and will try to fix the article