Cluster Statistics
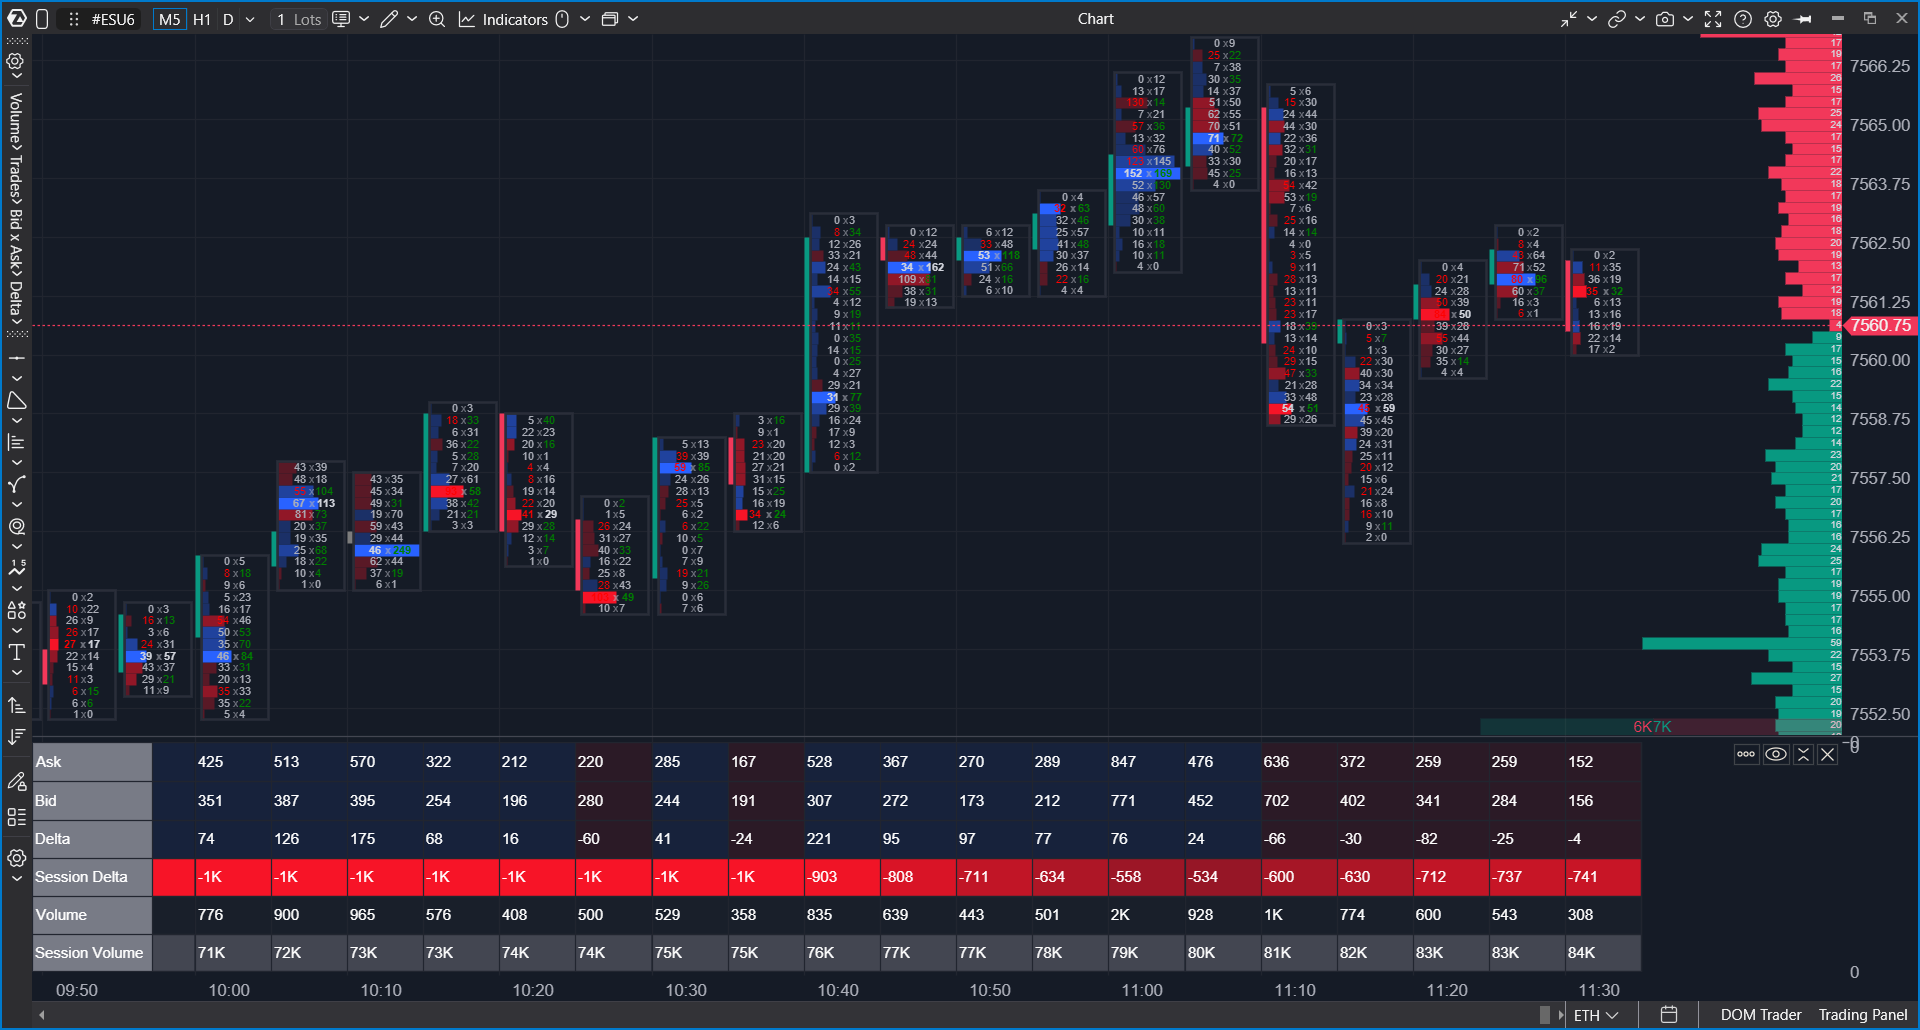
Cluster Statistics is an order flow indicator that displays extended statistics for each candle in a separate panel below the chart.
Use it to compare candles not only by price movement, but also by volume, delta, trading activity, session statistics, trade count, candle height, and other order flow metrics.
Adding the Indicator
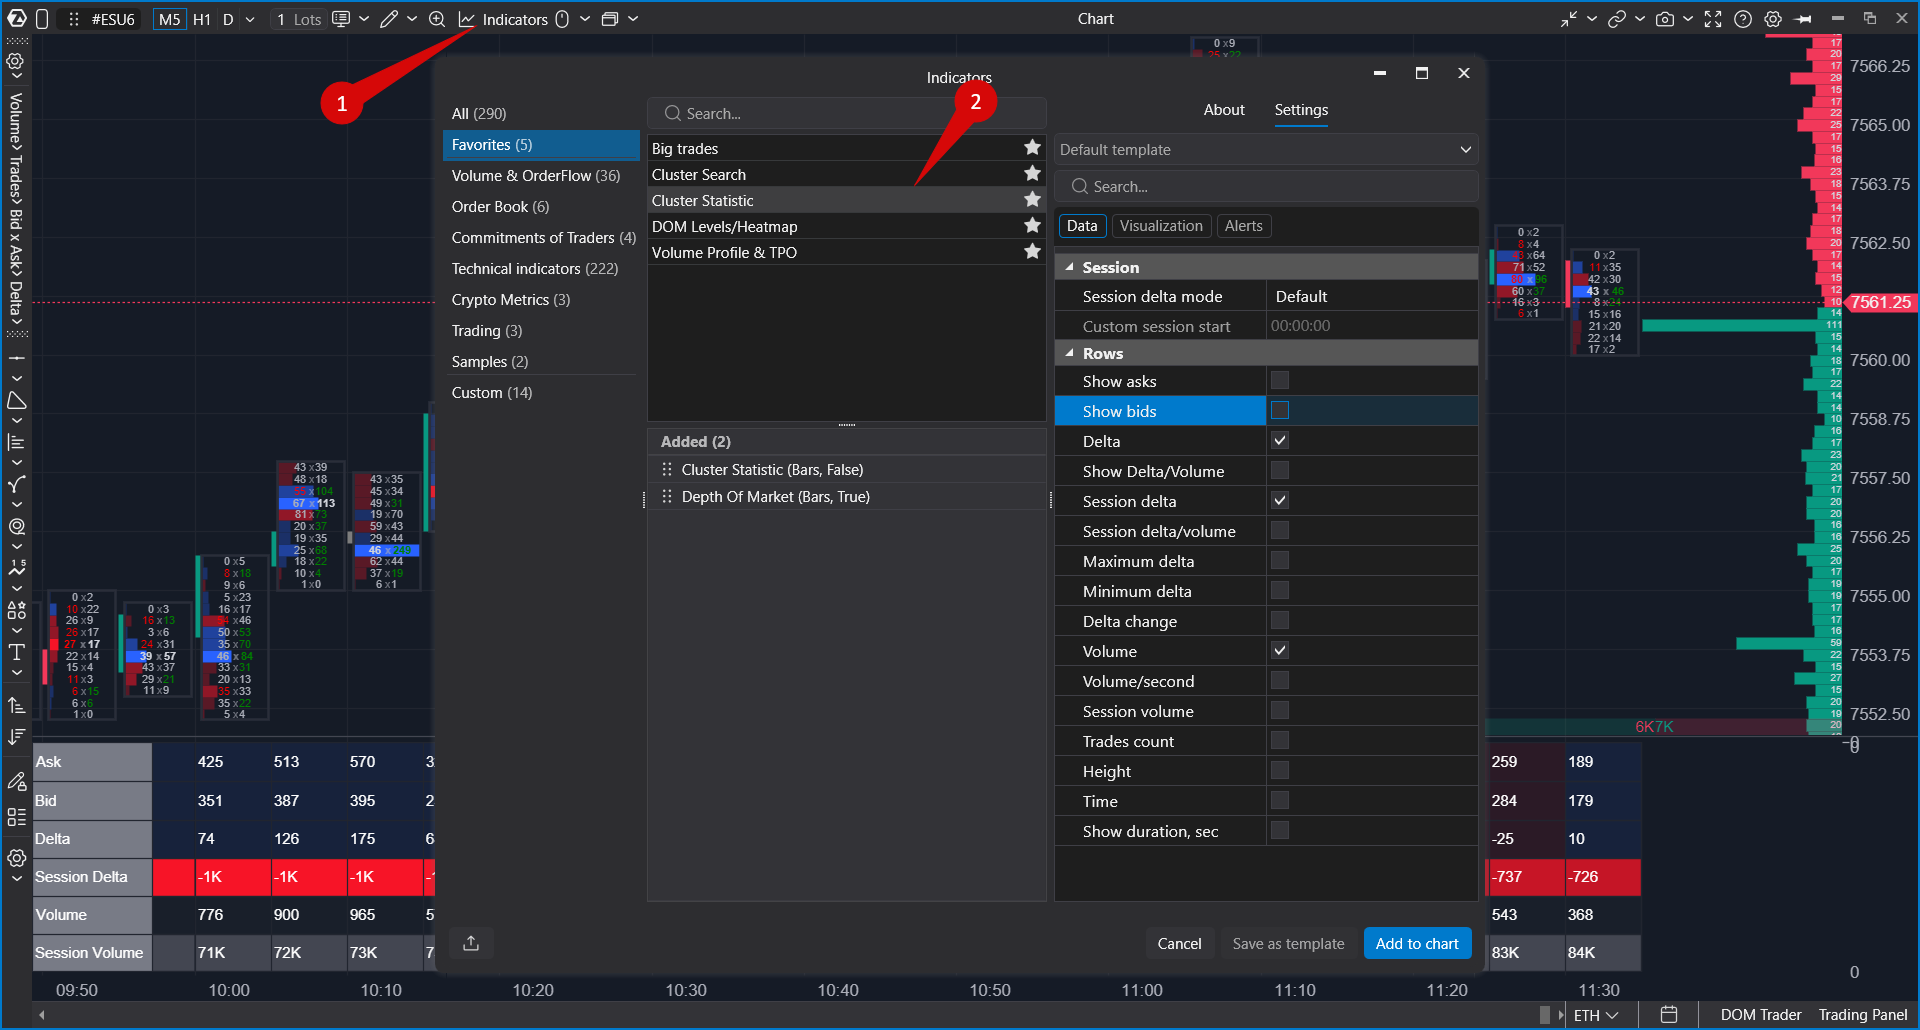
- Open a chart.
- Open the Indicators window from the chart toolbar, the chart context menu, or by pressing Ctrl + I.
- Search for Cluster Statistic.
- Click Add, then click OK.
After the indicator is added, it appears as a table below the chart. Each column represents a candle, while each enabled row displays a selected statistic.
Available Statistics
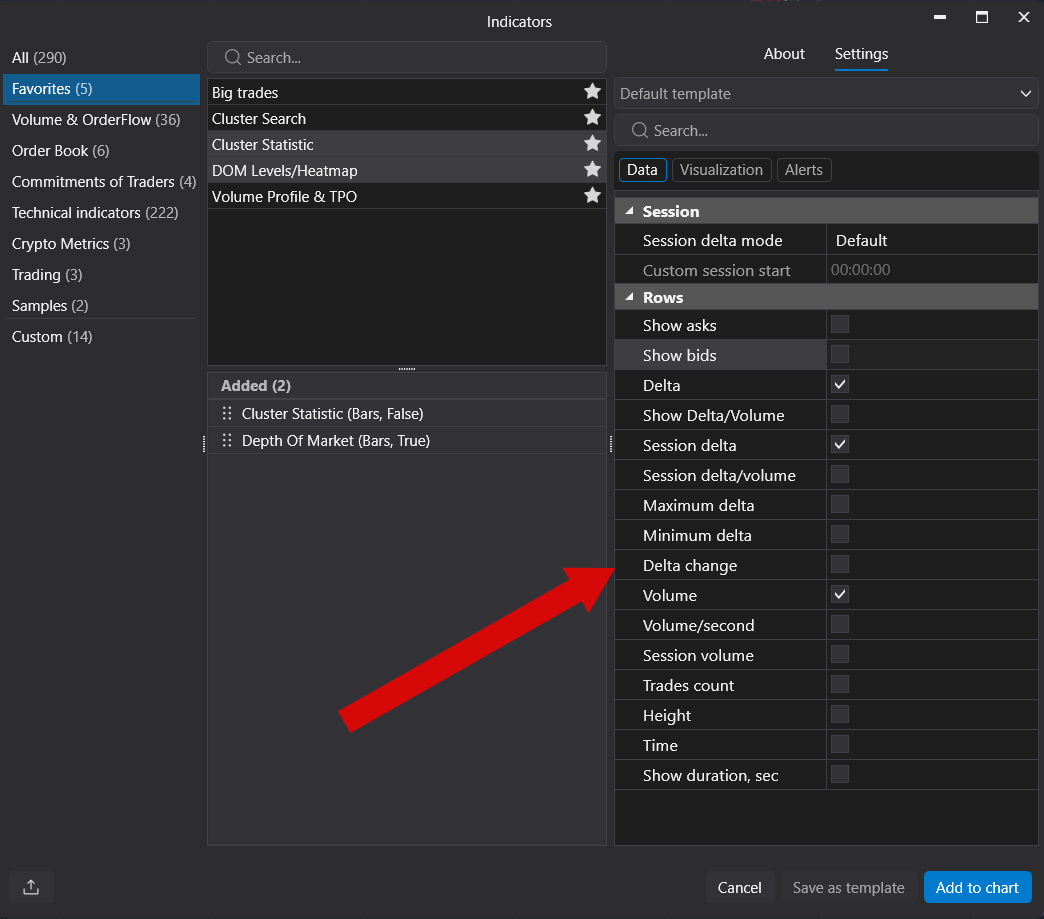
You can enable or disable individual rows depending on the information you want to analyze.
- Ask — Volume traded at the Ask.
- Bid — Volume traded at the Bid.
- Delta — Difference between Ask and Bid volume.
- Delta/Volume — Delta as a percentage of total candle volume.
- Session Delta — Cumulative Delta for the current session.
- Session Delta/Volume — Session Delta as a percentage of session volume.
- Max Delta — Maximum Delta value within the candle.
- Min Delta — Minimum Delta value within the candle.
- Delta Change — Delta change compared to the previous candle.
- Volume — Total traded volume.
- Volume/sec — Average traded volume per second.
- Session Volume — Cumulative session volume.
- Trades — Number of executed trades.
- Height — Candle height (High − Low).
- Time — Candle opening time.
- Duration — Candle duration in seconds.
By default, the indicator enables Delta, Session Delta, and Volume.
Session Settings
Session-based statistics can be calculated using different modes:
- None — cumulative values are calculated from the beginning of the loaded chart history.
- Default Session — cumulative values reset at the default session boundary.
- Custom Session — cumulative values reset at a user-defined session start time.
Use Custom Session Start if you want session statistics to begin from a specific time, such as the start of your trading session.
Visual Settings
Cluster Statistics uses color intensity to highlight stronger values. The following appearance settings are available:
- Background color and transparency.
- Grid color.
- Ask, Bid, and Volume colors.
- Text color, font, and alignment.
- Header background.
- Show or hide row headers.
The Proportion By Visible Part Of The Chart option changes how cell intensity is calculated:
- When enabled, scaling uses only the visible portion of the chart.
- When disabled, scaling uses the entire loaded history.
Working with the Panel
The indicator works as a compact statistics table:
- Columns correspond to chart candles.
- Rows display the selected metrics.
- Row headers can be hidden to save space.
- Hover over a cell to display its value if there is not enough room to show it.
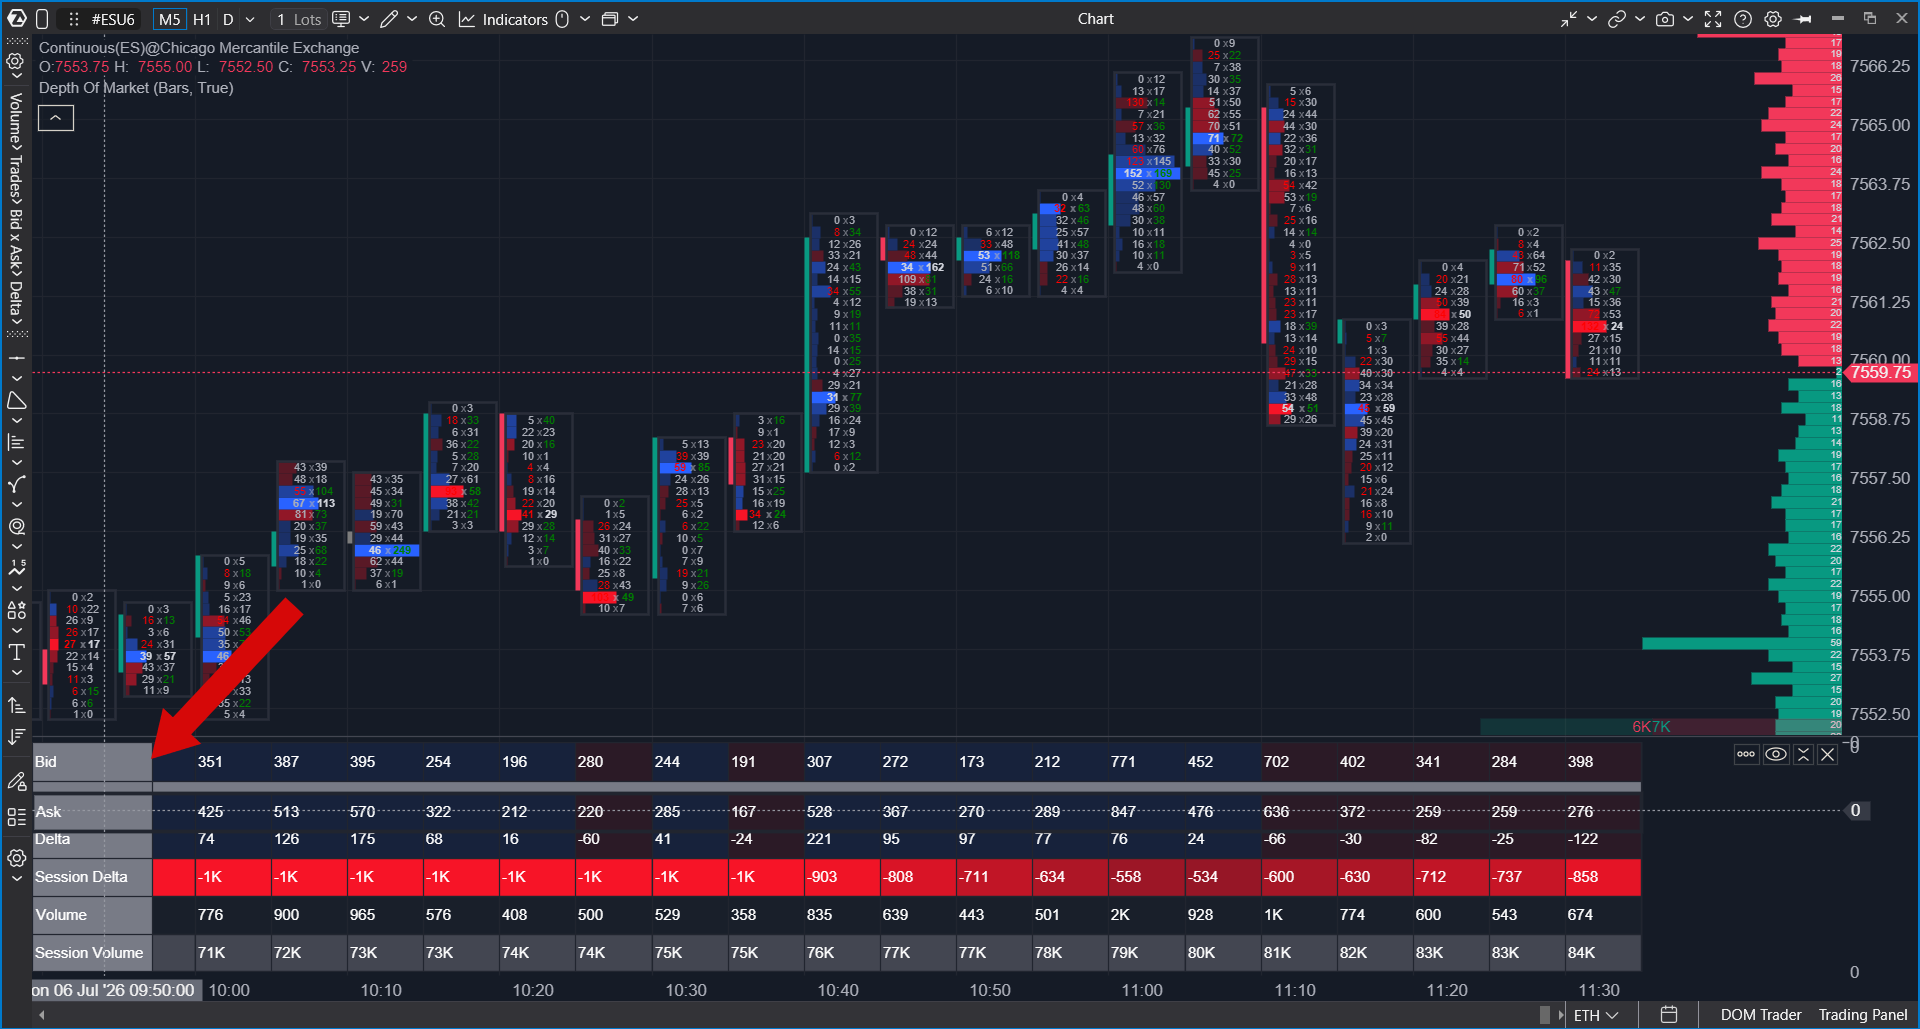
- Drag row headers to change the order of displayed statistics.
This allows you to organize the panel according to your preferred workflow and keep the most important statistics at the top.
Alerts
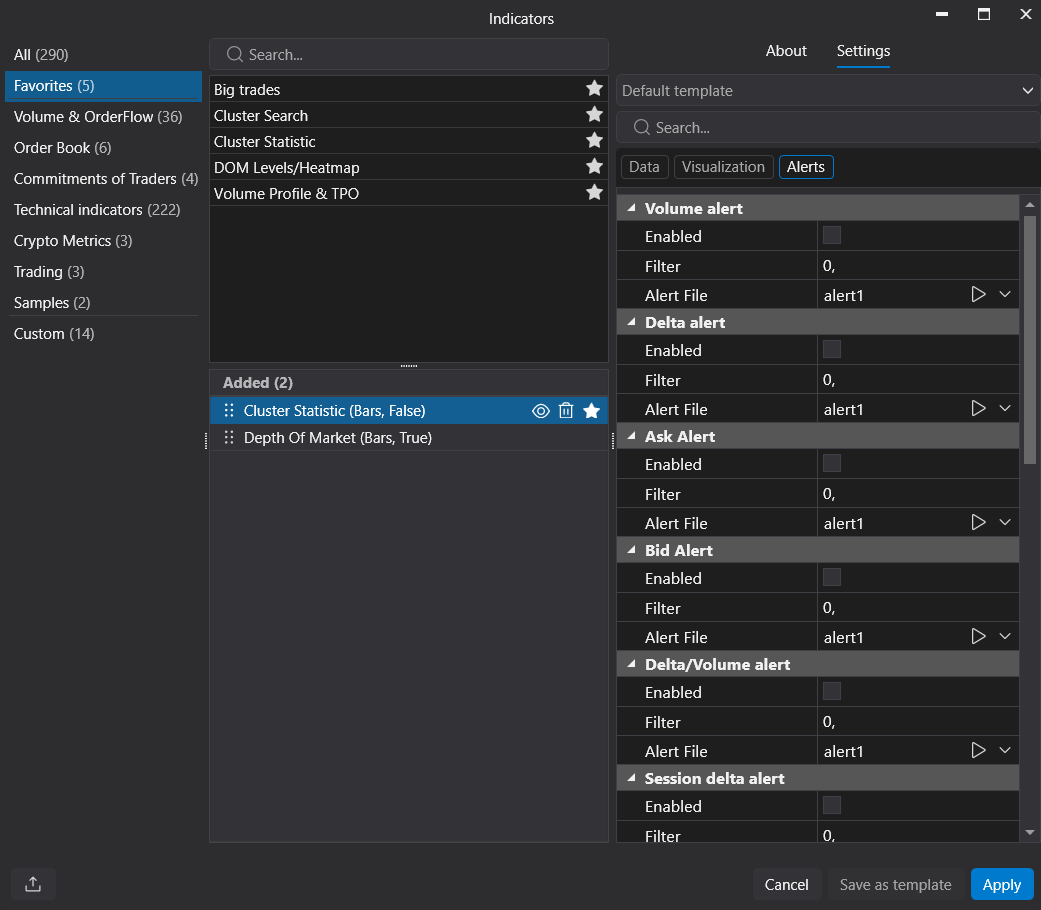
Cluster Statistics supports alerts for selected metrics. An alert is triggered when the configured filter value is reached or exceeded.
Alerts are available for:
- Volume
- Delta
- Ask
- Bid
- Delta/Volume
- Session Delta
- Session Delta/Volume
- Max Delta
- Min Delta
- Delta Change
- Volume/sec
- Session Volume
- Trades
- Height
For each alert, enable the alert, specify the filter value, and select the notification sound.
Using Cluster Statistics
Cluster Statistics helps compare candles using order flow data rather than price movement alone.
- Use Volume and Volume/sec to identify unusually active candles.
- Use Delta to evaluate whether buyers or sellers dominated.
- Use Session Delta and Session Volume to monitor cumulative buying or selling pressure.
- Use Delta Change to identify sudden shifts in market aggression.
- Use Trades to compare execution activity instead of total volume only.
- Compare Height together with Volume and Delta to evaluate price movement relative to trading activity.
Cluster Statistics is an analytical tool. It does not generate trading signals or place trades automatically.
Notes
- Indicator values depend on the selected instrument, timeframe, available market data, and loaded history.
- Session-based statistics depend on the selected session mode.
- If values become difficult to read, increase the chart zoom, reduce the number of displayed rows, or use tooltips.
- Hide unused statistics to keep the panel clean and focused on the metrics relevant to your analysis.
Was this article helpful?
That’s Great!
Thank you for your feedback
Sorry! We couldn't be helpful
Thank you for your feedback
Feedback sent
We appreciate your effort and will try to fix the article