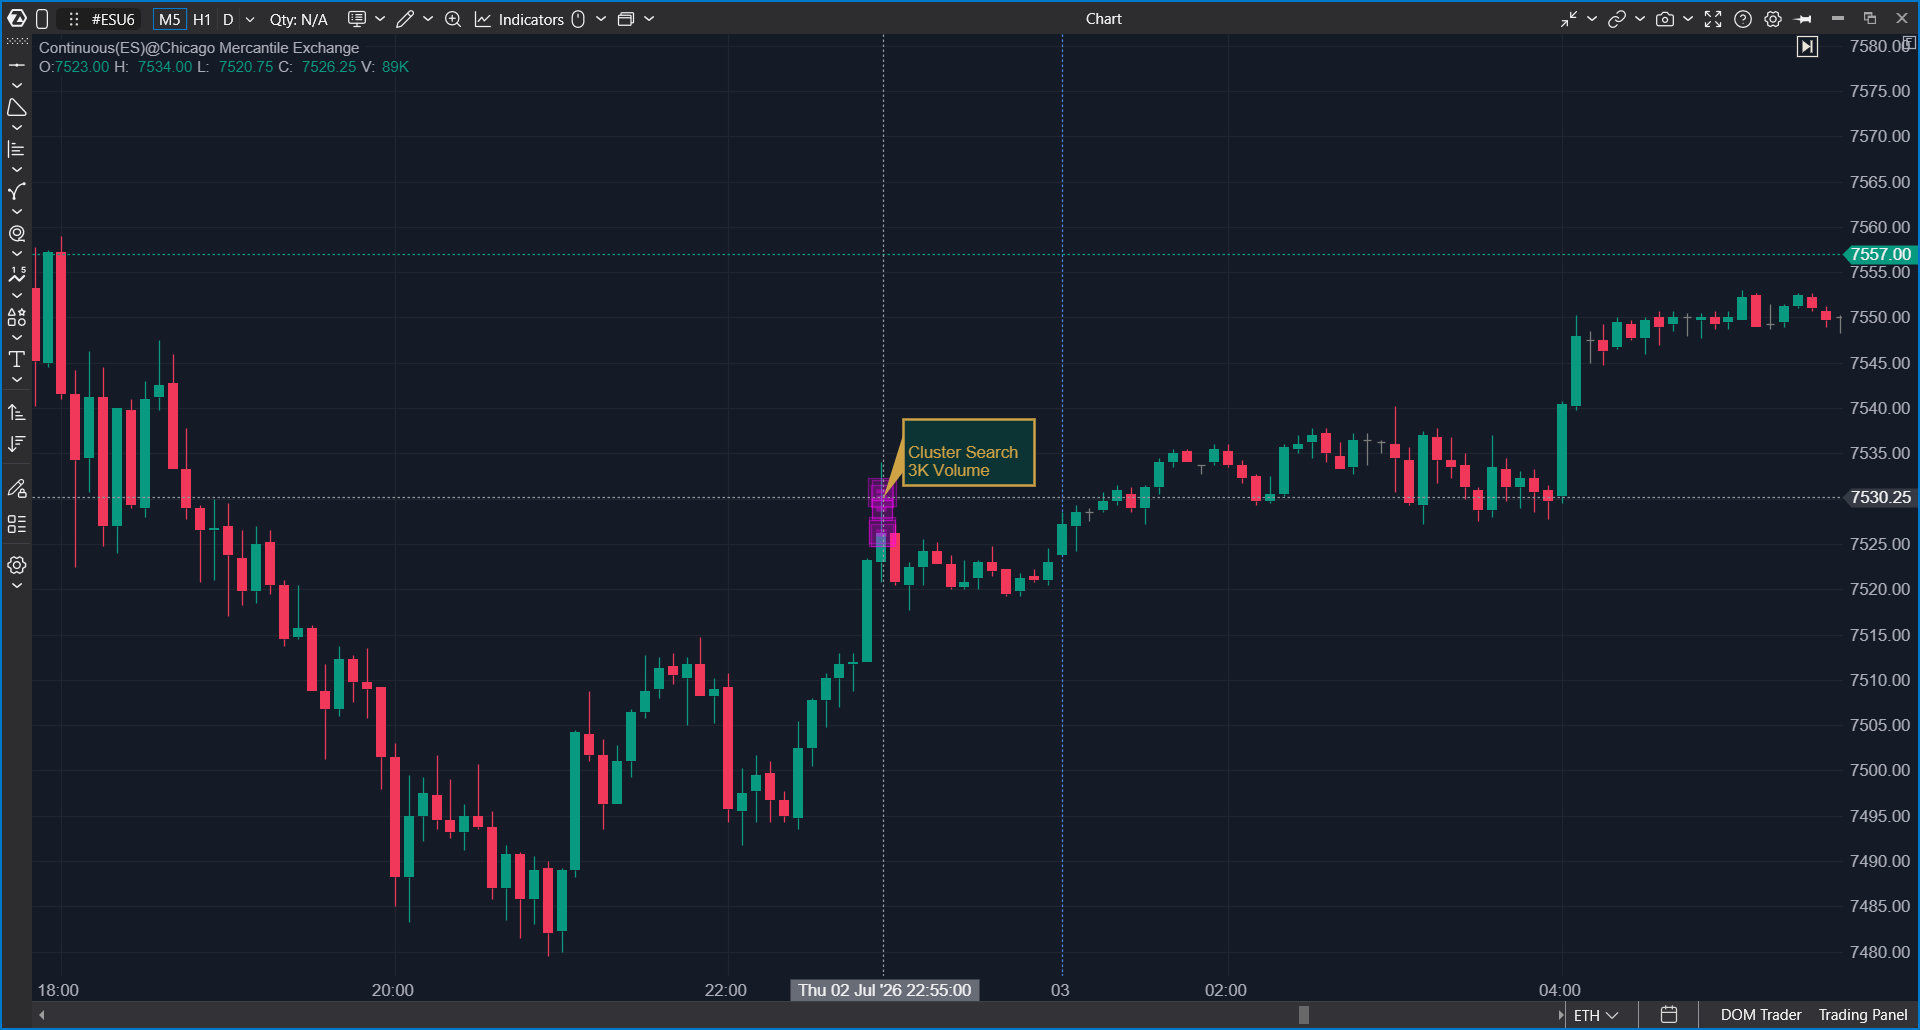
Cluster Search
The Cluster Search indicator analyzes footprint cluster data and highlights price levels that match selected filters.
Use it to identify significant clusters by volume, bid, ask, delta, ticks, or POC directly within candles.
Cluster Search helps locate areas with unusually high activity, strong buying or selling pressure, large delta values, important volume levels, or specific cluster patterns inside a candle.
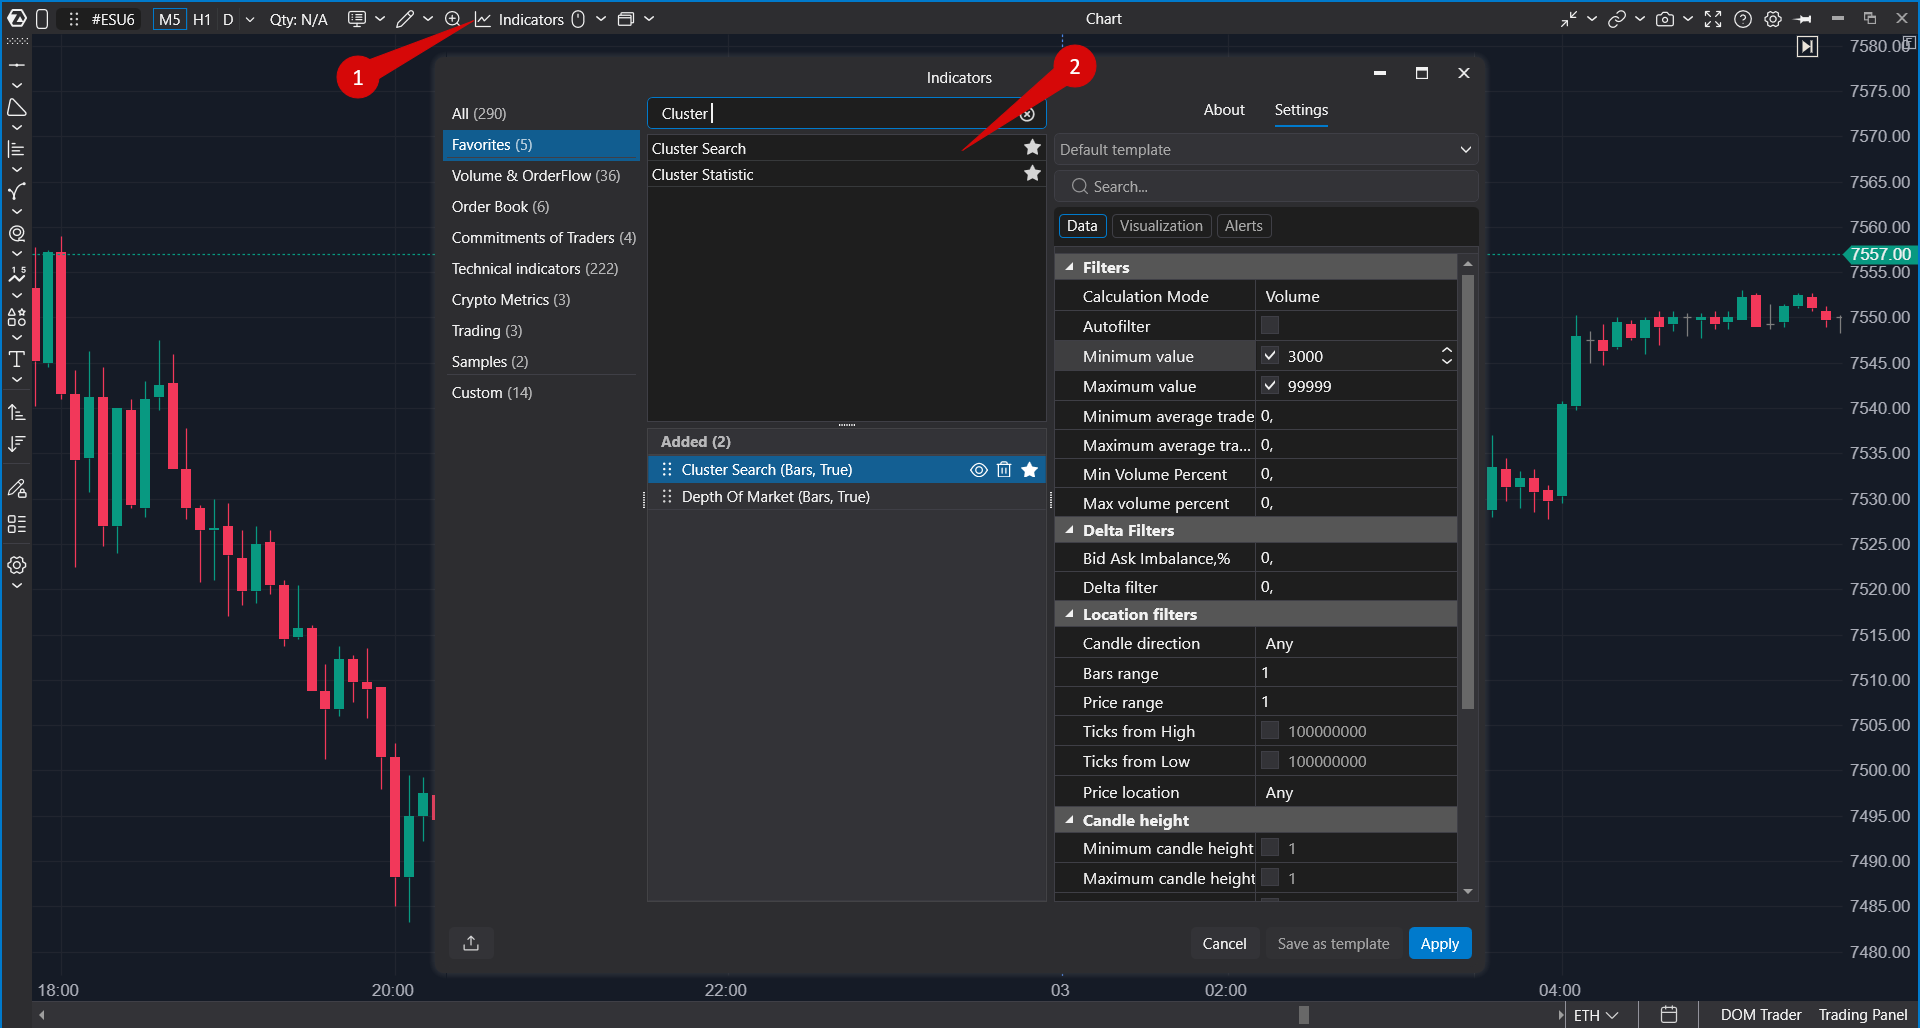
Adding the Indicator
- Open a chart.
- Open the Indicators window.
- Find Cluster Search.
- Add the indicator to the chart.
- Open the indicator settings and configure the required filters.
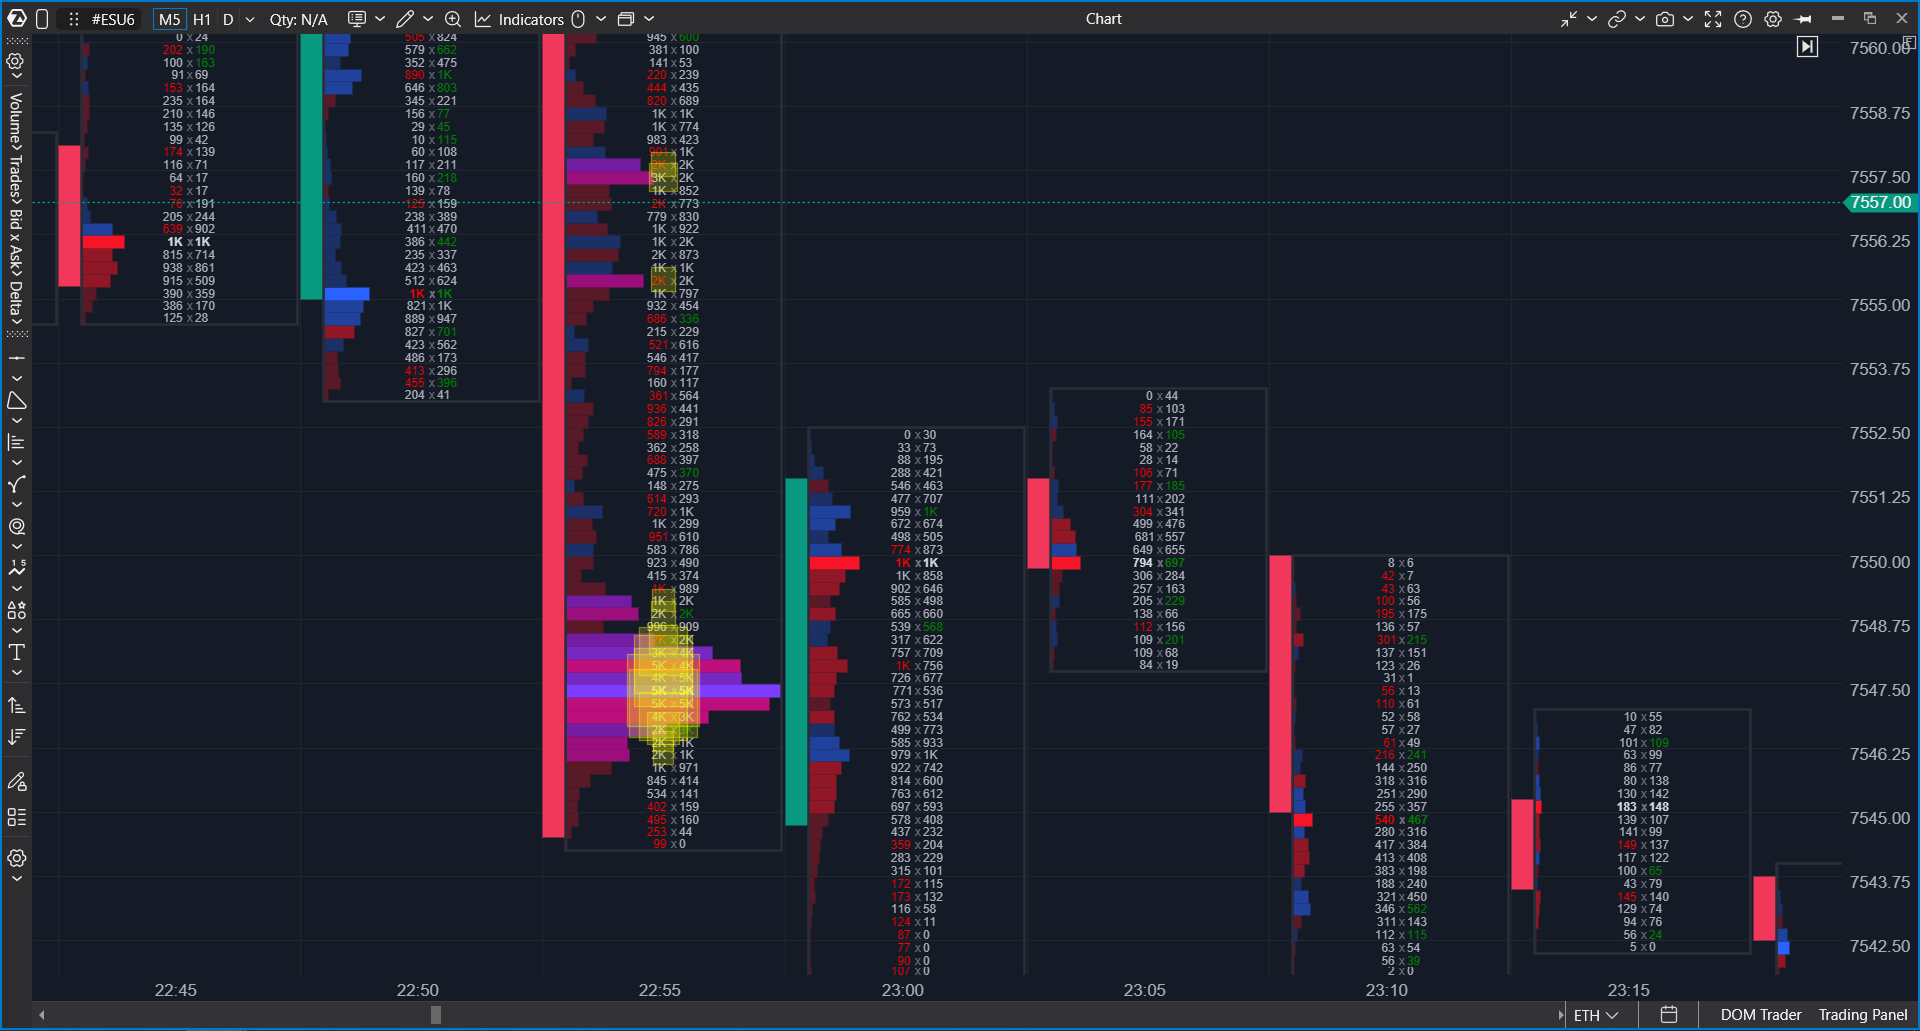
The indicator is displayed directly on the chart by marking matching price levels inside candles.
How Cluster Search Works
Cluster Search analyzes footprint data inside each candle and compares every price level against the selected filter conditions.
The indicator can search using the following calculation modes:
- Bid — volume traded at Bid.
- Ask — volume traded at Ask.
- Delta — Ask volume minus Bid volume.
- Volume — total traded volume at a price level.
- Ticks — number of trades executed at a price level.
- POC Level — the price level with the highest volume inside a candle.
Whenever a price level satisfies the selected conditions, the indicator highlights it on the chart.
Filters
The Filters section defines which cluster values should be detected.
- Calculation Mode — selects Bid, Ask, Delta, Volume, Ticks, or POC Level.
- Auto Filter — automatically adjusts the threshold for the selected instrument.
- Minimum Value — minimum cluster value to display.
- Maximum Value — maximum cluster value to display.
- Minimum Average Trade — minimum average trade size.
- Maximum Average Trade — maximum average trade size.
- Min Volume Percent — minimum percentage of candle or range volume.
- Max Volume Percent — maximum percentage of candle or range volume.
Use manual minimum and maximum values when you already know the required threshold. Use Auto Filter to let ATAS calculate an appropriate value automatically.
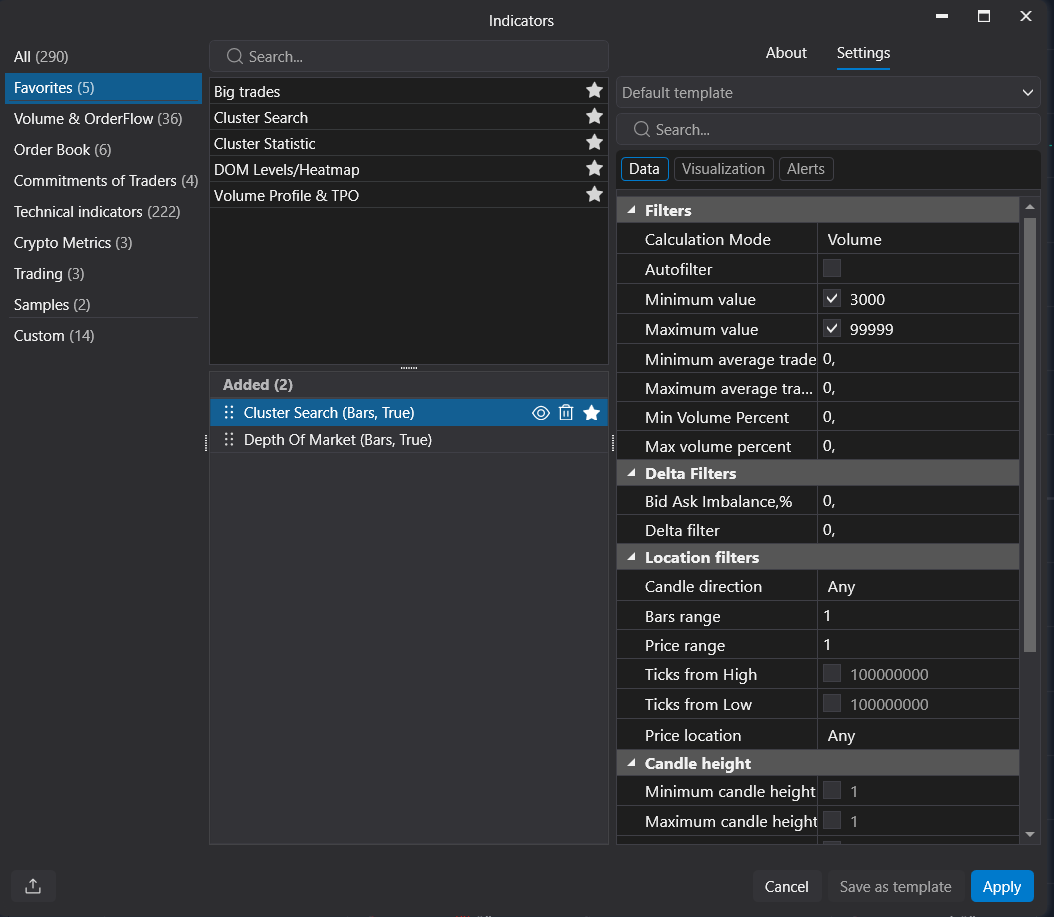
Delta Filters
The Delta Filters section refines the search based on buying or selling pressure.
- Bid Ask Imbalance (%) — filters clusters by Bid/Ask imbalance.
- Delta Filter — filters clusters by Delta value.
Positive Delta values indicate stronger Ask-side activity, while negative values indicate stronger Bid-side activity.
Location Filters
The Location Filters section limits where Cluster Search looks for matching values inside candles.
- Candle Direction — Bullish, Bearish, Neutral, or Any.
- Bars Range — combines multiple bars during analysis.
- Price Range — combines multiple price levels into one search range.
- Pips from High — limits the search distance from the candle high.
- Pips from Low — limits the search distance from the candle low.
- Price Location — specifies where inside the candle the cluster must appear.
Available Price Location options:
- Any
- At High
- At Low
- At High or Low
- Body
- Upper Wick
- Lower Wick
- Any Wick
These filters are useful when the exact location of the cluster is important, such as identifying activity near candle highs, lows, or inside wicks.
Candle Height Filters
The Candle Height section filters candles based on their size.
- Minimum Candle Height — minimum total candle height.
- Maximum Candle Height — maximum total candle height.
- Minimum Candle Body Height — minimum candle body size.
- Maximum Candle Body Height — maximum candle body size.
These filters help isolate activity only within candles of a specific size.
Time Filtration
The Time Filtration section limits calculations to a selected trading session or time interval.
- Use Time Filter — enables time filtering.
- Time From — start time.
- Time To — end time.
When enabled, only candles within the specified time range are analyzed.
Calculation
The Calculation section controls how much historical data is processed.
- Days Look Back — number of previous trading days to analyze.
- Use Previous Close — performs calculations only after a candle is completed.
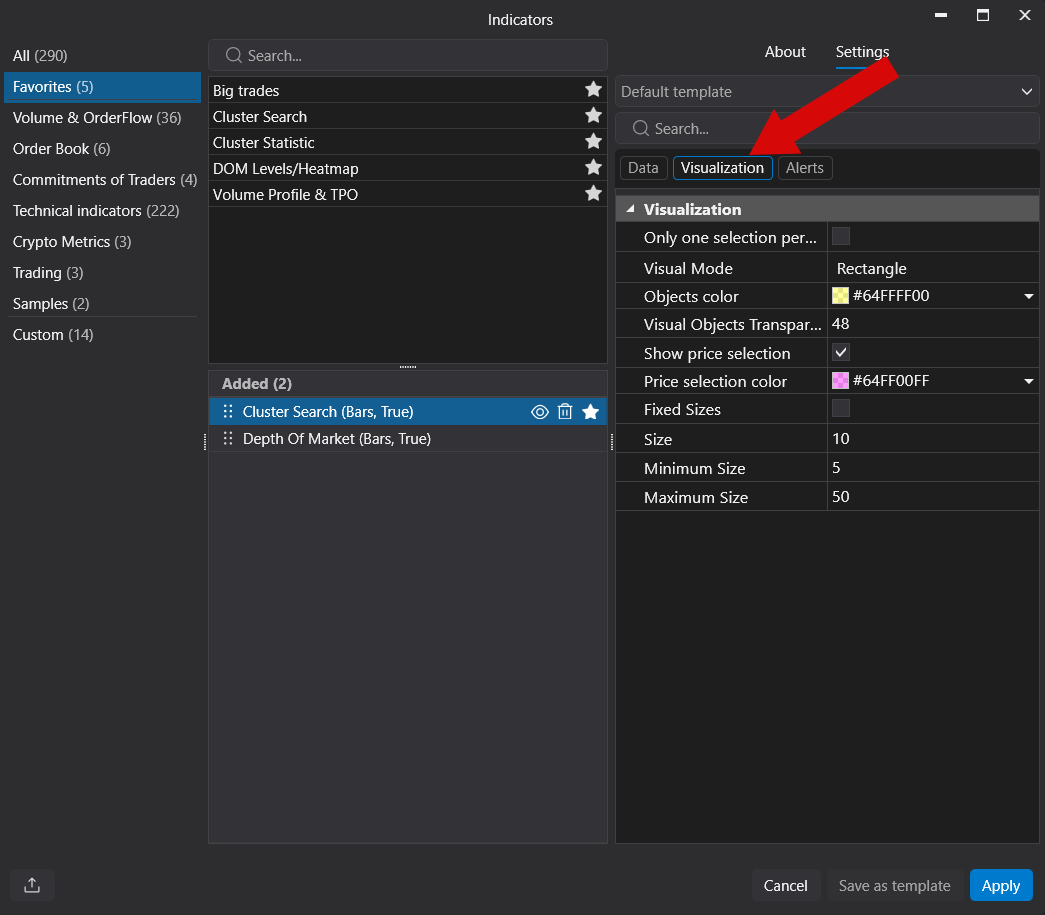
Visualization
The Visualization section controls how matching clusters are displayed.
- Only One Selection per Bar — shows only the strongest cluster in each candle.
- Visual Mode — marker style.
- Objects Color — marker color.
- Visual Objects Transparency — marker transparency.
- Show Price Selection — highlights the matching price level.
- Price Selection Color — highlight color.
- Fixed Sizes — displays all markers using the same size.
- Size — standard marker size.
- Minimum Size — minimum marker size.
- Maximum Size — maximum marker size.
If Fixed Sizes is disabled, marker size is automatically scaled according to cluster strength.
Alerts
The Alerts section allows notifications when a matching cluster is detected.
- Use Alerts — enables notifications.
- Alert File — selects the notification sound.
- Background — sets the notification background color.
Alerts are triggered whenever a cluster matching the current filters appears during live calculations.
Example Use Cases
Cluster Search can be used to find:
- large volume clusters;
- strong Bid or Ask activity;
- positive or negative Delta clusters;
- POC levels inside candles;
- clusters near candle highs or lows;
- clusters inside candle bodies or wicks;
- activity during a specific trading session;
- the strongest cluster within each candle.
Important Notes
- Cluster Search requires footprint (cluster) data.
- Results depend on the selected instrument, data feed, timeframe, available history, and filter settings.
- Very restrictive filters may produce no results.
- Very broad filters may generate too many markers and reduce chart readability.
- The indicator only highlights matching clusters. It does not place orders or modify market data.
Was this article helpful?
That’s Great!
Thank you for your feedback
Sorry! We couldn't be helpful
Thank you for your feedback
Feedback sent
We appreciate your effort and will try to fix the article