Divergence is an order flow indicator that finds divergences between the price and the selected indicator: Cumulative Volume Delta (CVD), Open Interest or RSI. It works in ATAS and ATAS X.
A divergence means that the price and the indicator moved differently between two peaks. For example, the price made a higher high, but CVD did not. The indicator marks each divergence with an arrow on the price chart and connects the two peaks with lines on the chart and in the indicator panel.
Divergence is not a trading signal by itself. It shows where the price and the selected indicator disagree. How to use this information is your decision.
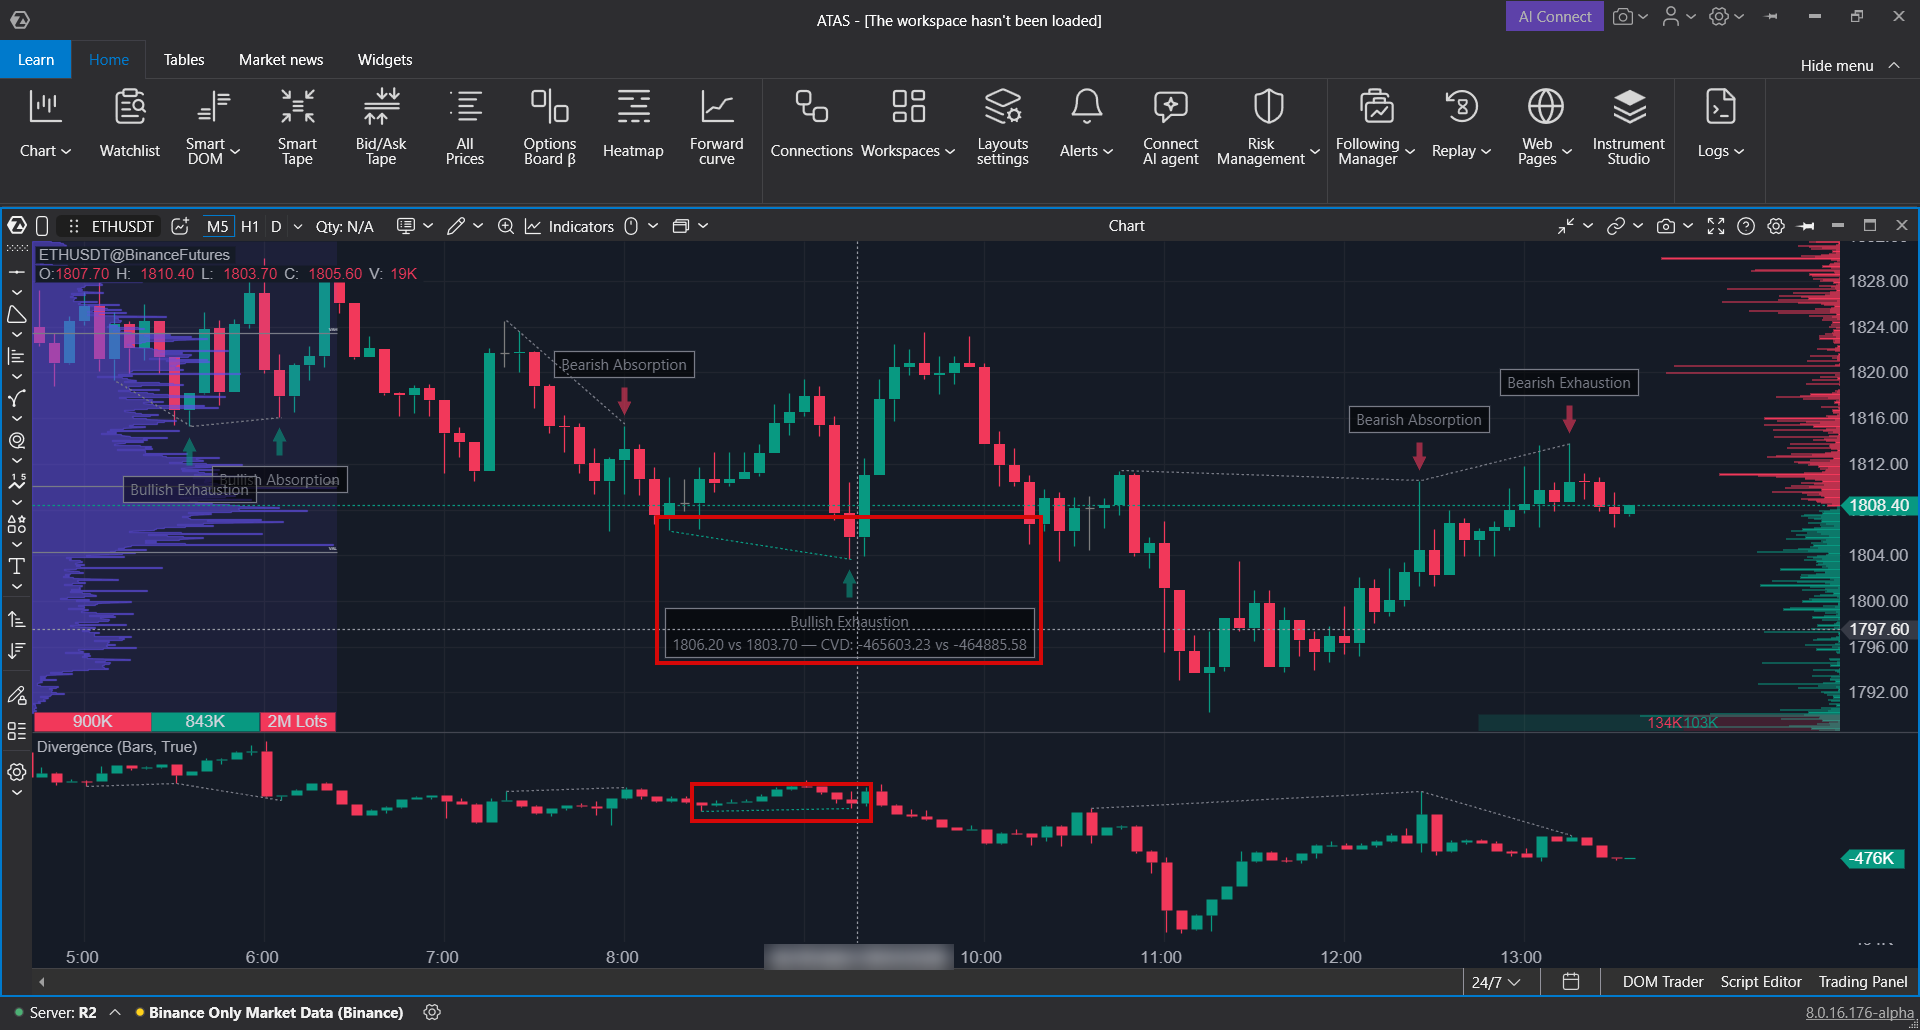
How the Indicator Finds a Divergence
- The indicator finds peaks (highs and lows) on the price chart and, separately, on the selected indicator. A bar is a peak when it is higher (or lower) than the bars around it; Quality sets how many bars are checked.
- Two peaks of the same kind (two highs or two lows) form a pair: the first peak and the second peak.
- A divergence is a price pair and an indicator pair whose peaks are on the same bars (within Tolerance) and which point in opposite directions.
- The arrow is placed at the second price peak. One second peak gives one divergence.
A peak is confirmed only after the bars to its right have closed. That is why an arrow appears a few bars after the peak itself, not on the peak bar in real time.
Divergence Types
For CVD and Open Interest, the types are called Exhaustion and Absorption. For RSI, the same types are called Regular and Hidden. Divergences at highs are bearish, divergences at lows are bullish.
| Type (CVD, Open Interest) | Type (RSI) | Price | Indicator |
| Bearish Exhaustion | Bearish Regular | Higher high | No higher high |
| Bullish Exhaustion | Bullish Regular | Lower low | No lower low |
| Bearish Absorption | Bearish Hidden | No higher high | Higher high |
| Bullish Absorption | Bullish Hidden | No lower low | Lower low |
An equal value counts as "no higher high" or "no lower low".
On the chart:
- a bullish divergence is an up arrow under the low, a bearish divergence is a down arrow above the high;
- the label next to the arrow shows the type, for example Bullish Exhaustion;
- hover over the label to see the prices of both peaks and the indicator values at them; the lines of this divergence are highlighted with Bullish color or Bearish color.
Choose the Source
Select the indicator in Source on the Data tab. The panel under the chart changes with the source.
CVD
The default source. CVD is shown as candles with a zero line. By default it is calculated continuously, without a reset at the start of a session. To reset it by session, change Session delta mode in the CVD group. See CVD - Cumulative Volume Delta.
Open Interest
Open interest is shown as candles. It works only for instruments for which your connection provides open interest data. If there is no open interest for the instrument, the panel stays empty and shows Current instrument is not supported by the Open Interest data feed. If open interest history starts later than the price history, the search starts from the first bar with open interest. See Open Interest (OI).
RSI
RSI is shown as a line with the overbought and oversold levels (70 and 30 by default). It is calculated the same way as the standard RSI indicator. Turn on Overbought/Oversold zones only to show a divergence only when the second RSI peak is inside the zone: above Overbought for highs, below Oversold for lows. See RSI.
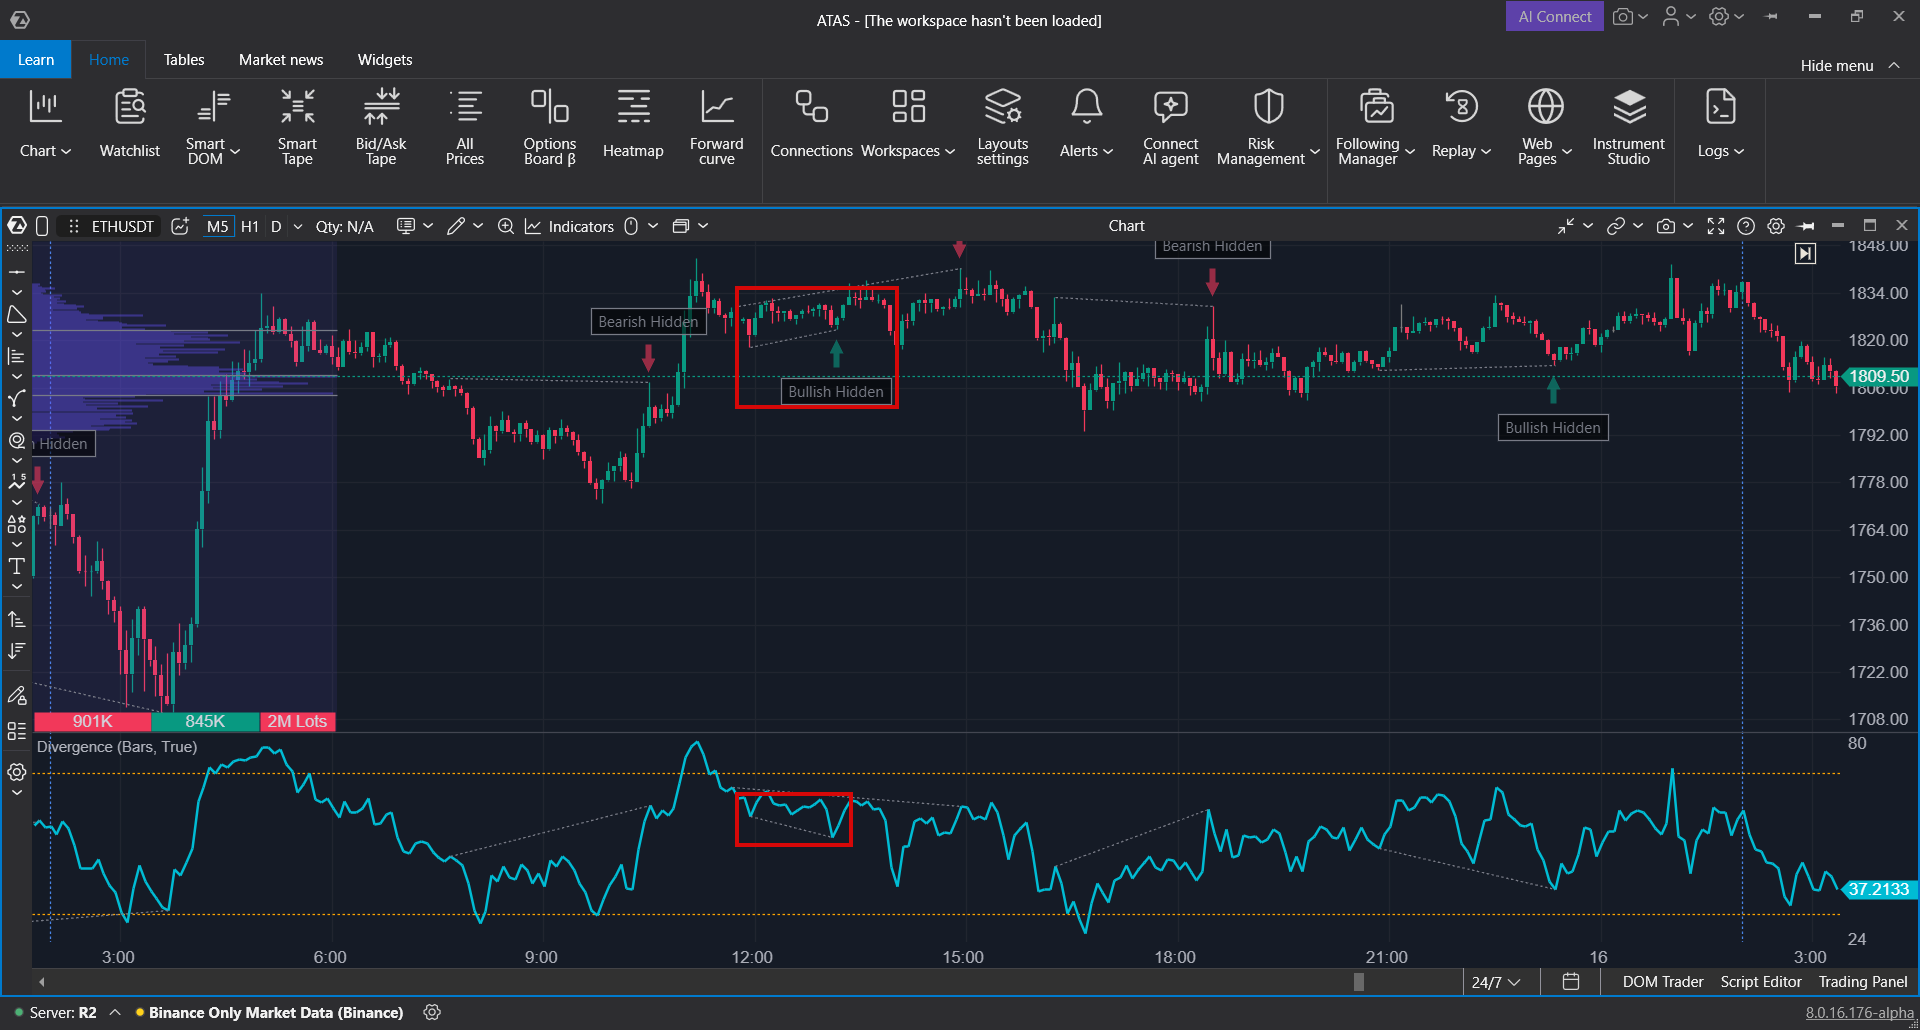
Add the Indicator
- Open a chart and click Indicators on the chart toolbar. See Indicator settings window.
- Type Divergence in the search box and double-click it. It appears in the Added list, and its settings open on the right.
- Choose Source and adjust the settings if needed.
- Click Apply.
The indicator always opens in its own panel under the chart.
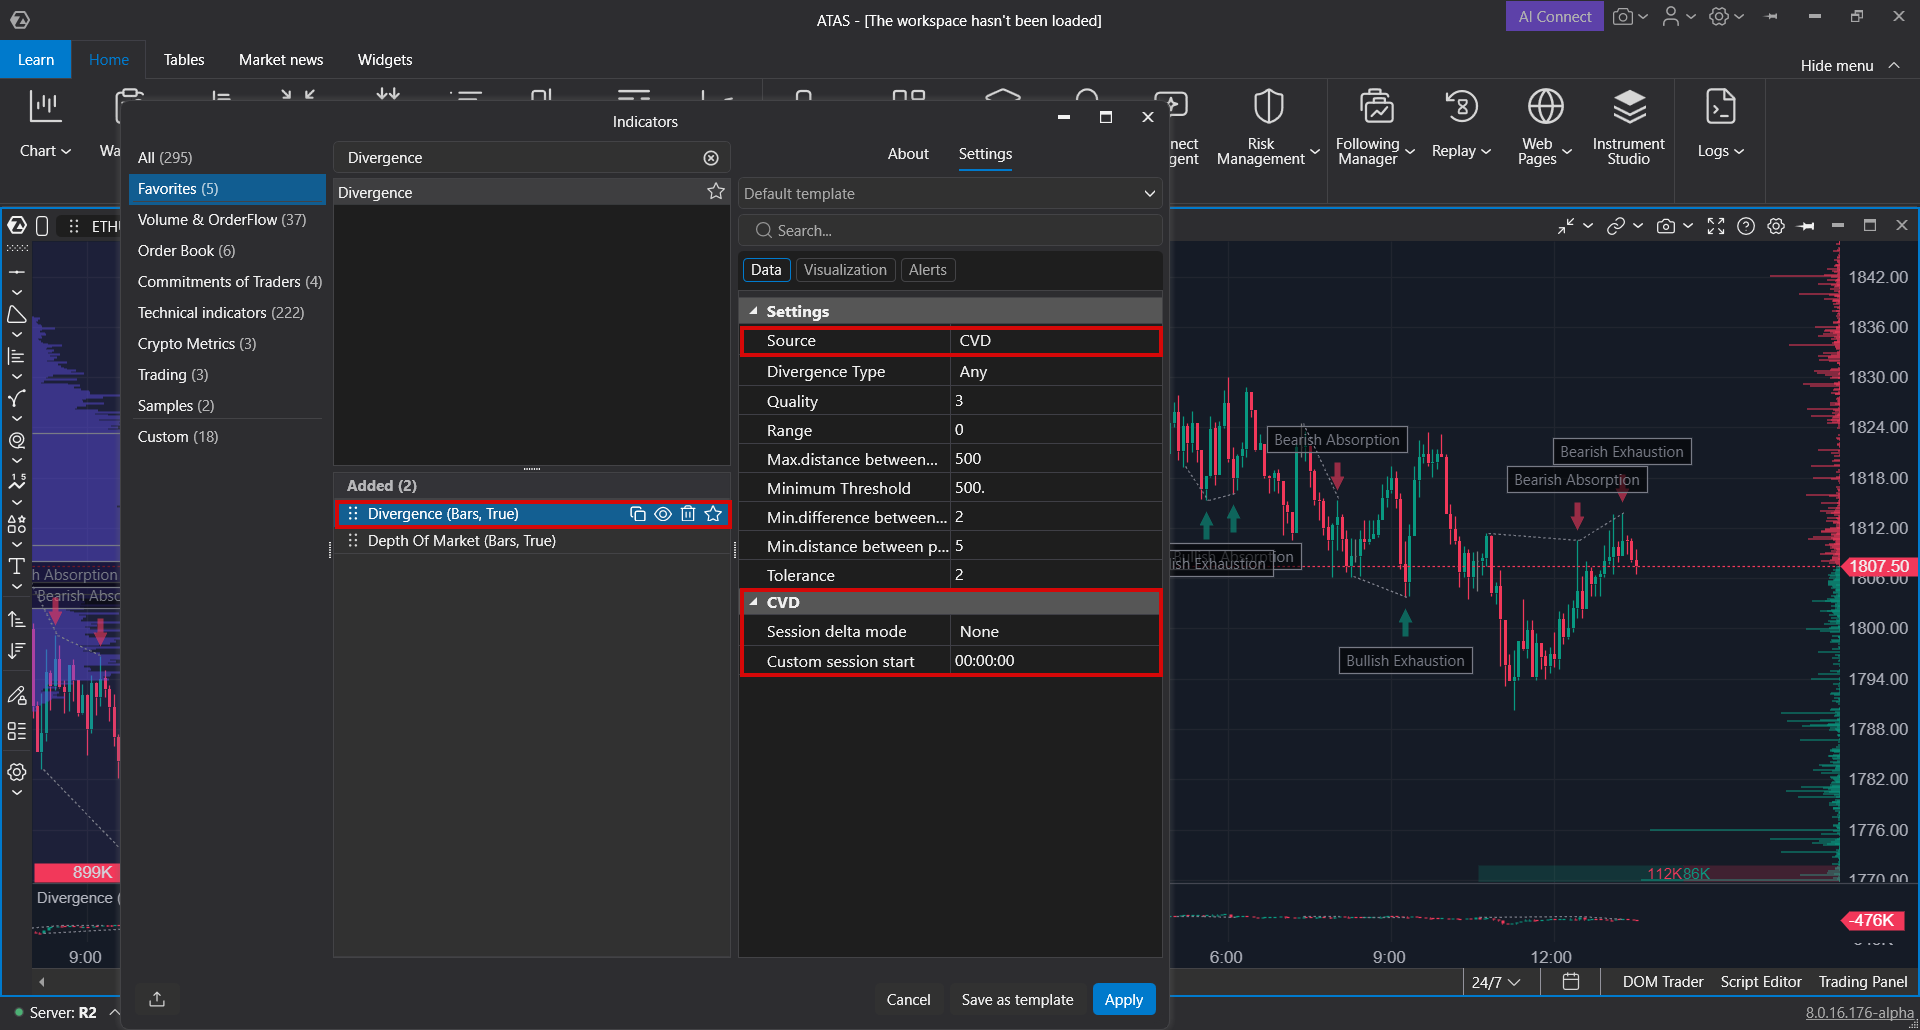
Settings
Data Tab: Settings
| Setting | Default | What it does |
| Source | CVD | The indicator whose peaks are compared with the price peaks: CVD, Open Interest or RSI. |
| Divergence Type | Any | Which divergences to show. CVD and Open Interest: Any, Exhaustion, Absorption. RSI: Any, Regular, Hidden. |
| Quality | 3 | How many bars around a peak confirm it (from 2 to 100). With 3, a bar is a high if its high is above the highs of 2 bars on each side (for a low, below). Higher values leave only the major peaks, and arrows appear later. |
| Range | 0 | The search depth in bars from the last bar. 0 searches the whole history. |
| Max.distance between peaks (bars) | 500 | Peaks further apart than this are not compared with each other. |
| Minimum Threshold | 500 for CVD, 500 for Open Interest, 5 for RSI | The minimum change of the selected indicator between the two peaks. Each source keeps its own value. |
| Min.difference between peaks (ticks) | 2 | The minimum price difference between the two price peaks. |
| Min.distance between peaks (bars) | 5 | Peaks closer than this are not compared with each other. |
| Tolerance | 2 | The allowed mismatch in bars between the price peaks and the indicator peaks. |
Minimum Threshold is set in the units of the selected indicator, as shown in the panel: volume for CVD, open interest for Open Interest, RSI points for RSI.
Data Tab: CVD
Shown only when Source is CVD.
| Setting | Default | What it does |
| Session delta mode | None | None: continuous CVD without a reset. Default: reset at the start of each session. Custom session: reset at the time set below. |
| Custom session start | 00:00:00 | The reset time for the Custom session mode. |
Data Tab: Relative strength index
Shown only when Source is RSI.
| Setting | Default | What it does |
| Period | 14 | The RSI period. |
| Overbought/Oversold zones only | Off | Show a divergence only when the second RSI peak is inside the overbought or oversold zone. |
| Overbought | 70 | The overbought level. |
| Oversold | 30 | The oversold level. |
Visualization Tab
- Up candle color / Down candle color - colors of the CVD or Open Interest candles in the panel;
- Lines - color, width and style of the lines between the peaks;
- RSI line - the RSI line (RSI source only);
- Overbought/Oversold lines - the level lines (RSI source only);
- Bullish color / Bearish color - colors of the arrows and of the highlighted lines;
- Arrow size (1-5), Arrow distance (gap between the arrow and the price peak), Arrow transparency (0-10);
- Label font - font of the labels next to the arrows;
- Zero in the Lines group - the zero line of the CVD panel (CVD source).
Alerts
On the Alerts tab, turn on Use alerts to get a notification when a new divergence appears. Choose the sound in Alert File and the notification colors in Font Color and Background. The notification text shows the type, for example Divergence: Bullish Exhaustion.
Alerts work only for new divergences in real time. Divergences found on history do not trigger alerts.
Good to Know
- Arrows appear with a delay of a few bars because a peak needs closed bars on its right. A lower Quality gives earlier but more frequent signals.
- When you change Source, Minimum Threshold switches to the value saved for that source.
- Thresholds are not converted to money: they stay in the units of the selected indicator.
- The Delta Divergence widget is a different tool: it tracks price and delta in real time over several short time windows. The Divergence indicator compares peaks on the chart.
If Something Goes Wrong
| Problem | What to do |
| The arrow appeared a few bars after the peak. | This is expected: the peak is confirmed by the bars to its right. Lower Quality to get earlier arrows. |
| The panel shows "Current instrument is not supported by the Open Interest data feed." | Your connection provides no open interest for this instrument. Choose CVD or RSI as the source. |
| Too many divergences. | Raise Minimum Threshold, Quality or Min.difference between peaks (ticks), or choose one type in Divergence Type. |
| Too few divergences or none. | Lower Minimum Threshold; check that Range is 0 or large enough, that Divergence Type is Any, and, for RSI, that Overbought/Oversold zones only is off. Load more history on the chart. |
| No alerts. | Check that Use alerts is on. Alerts come only for new divergences in real time. |
Was this article helpful?
That’s Great!
Thank you for your feedback
Sorry! We couldn't be helpful
Thank you for your feedback
Feedback sent
We appreciate your effort and will try to fix the article